BTC/USD
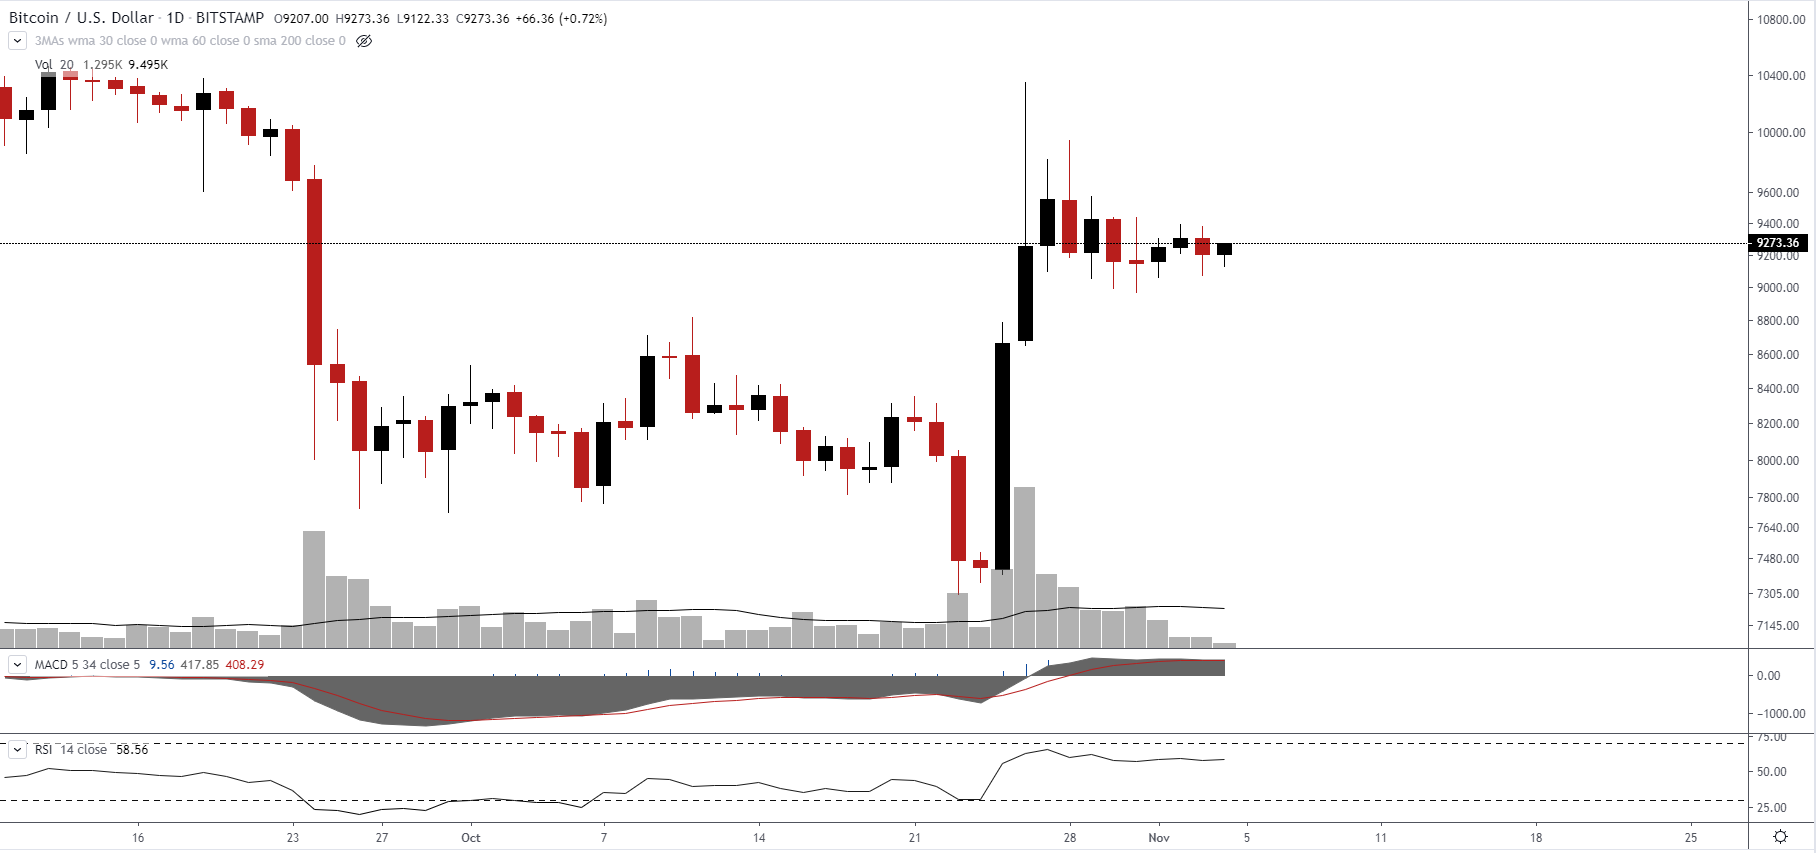
@ExratesmeHere is a daily chart Bitcoin against USD
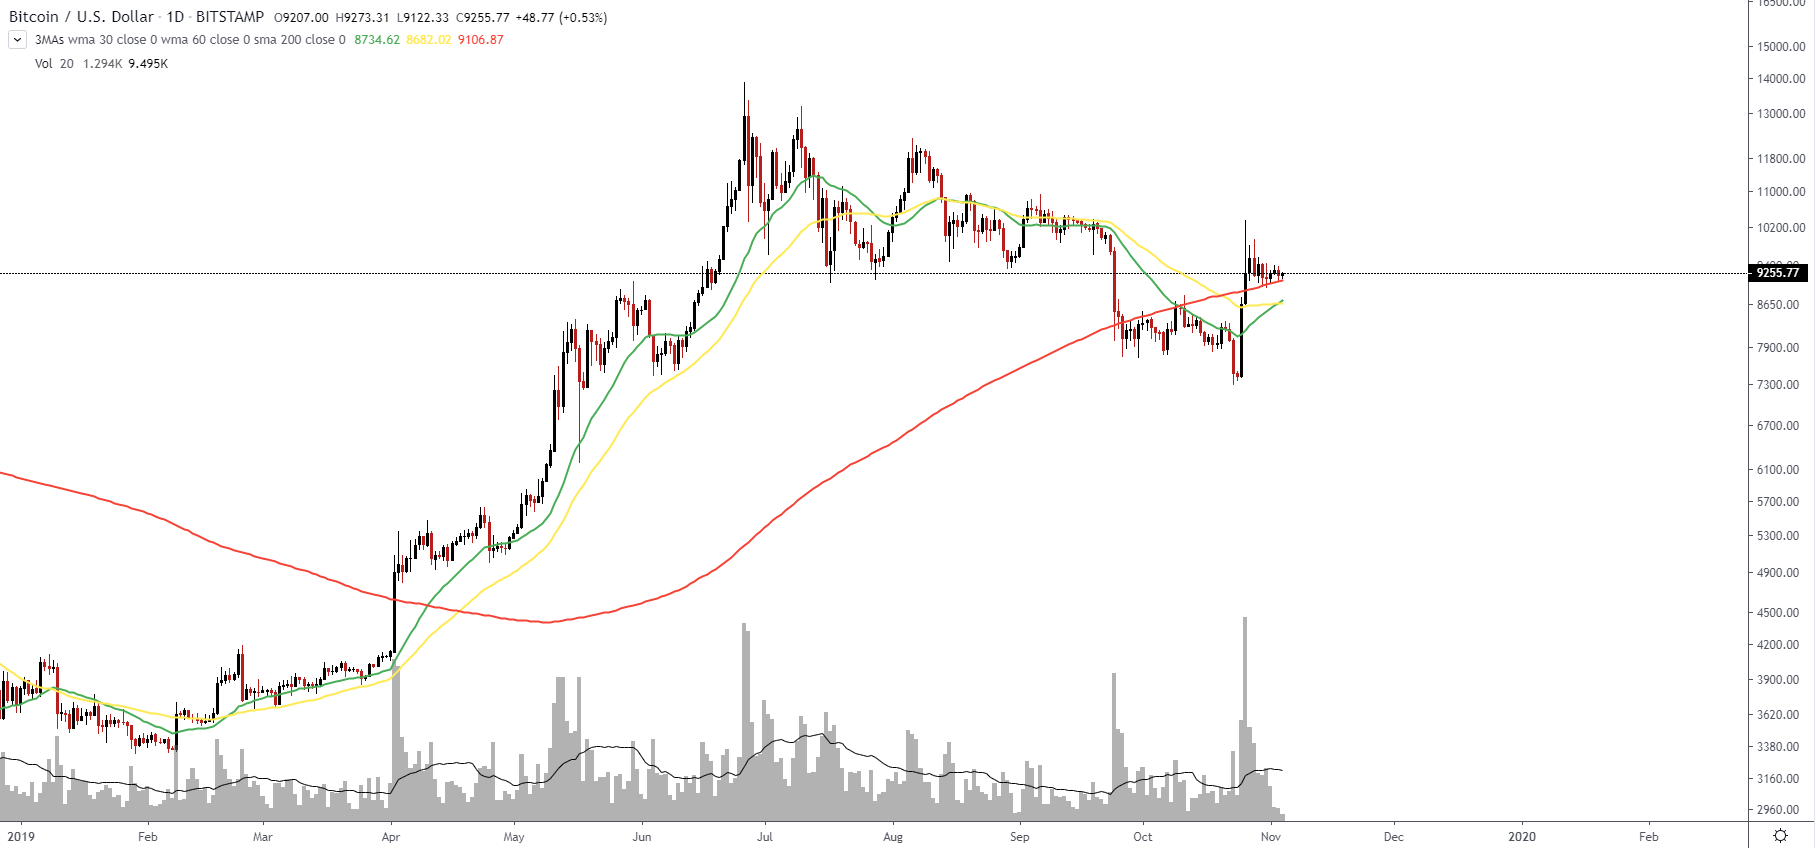
As you can see from the chart the price is holding above all three moving average and all of them look up, but the same time 30-day and 60-day moving averages have crossed the 200-day MA which is called 'death cross' and that is a very bearish sign.
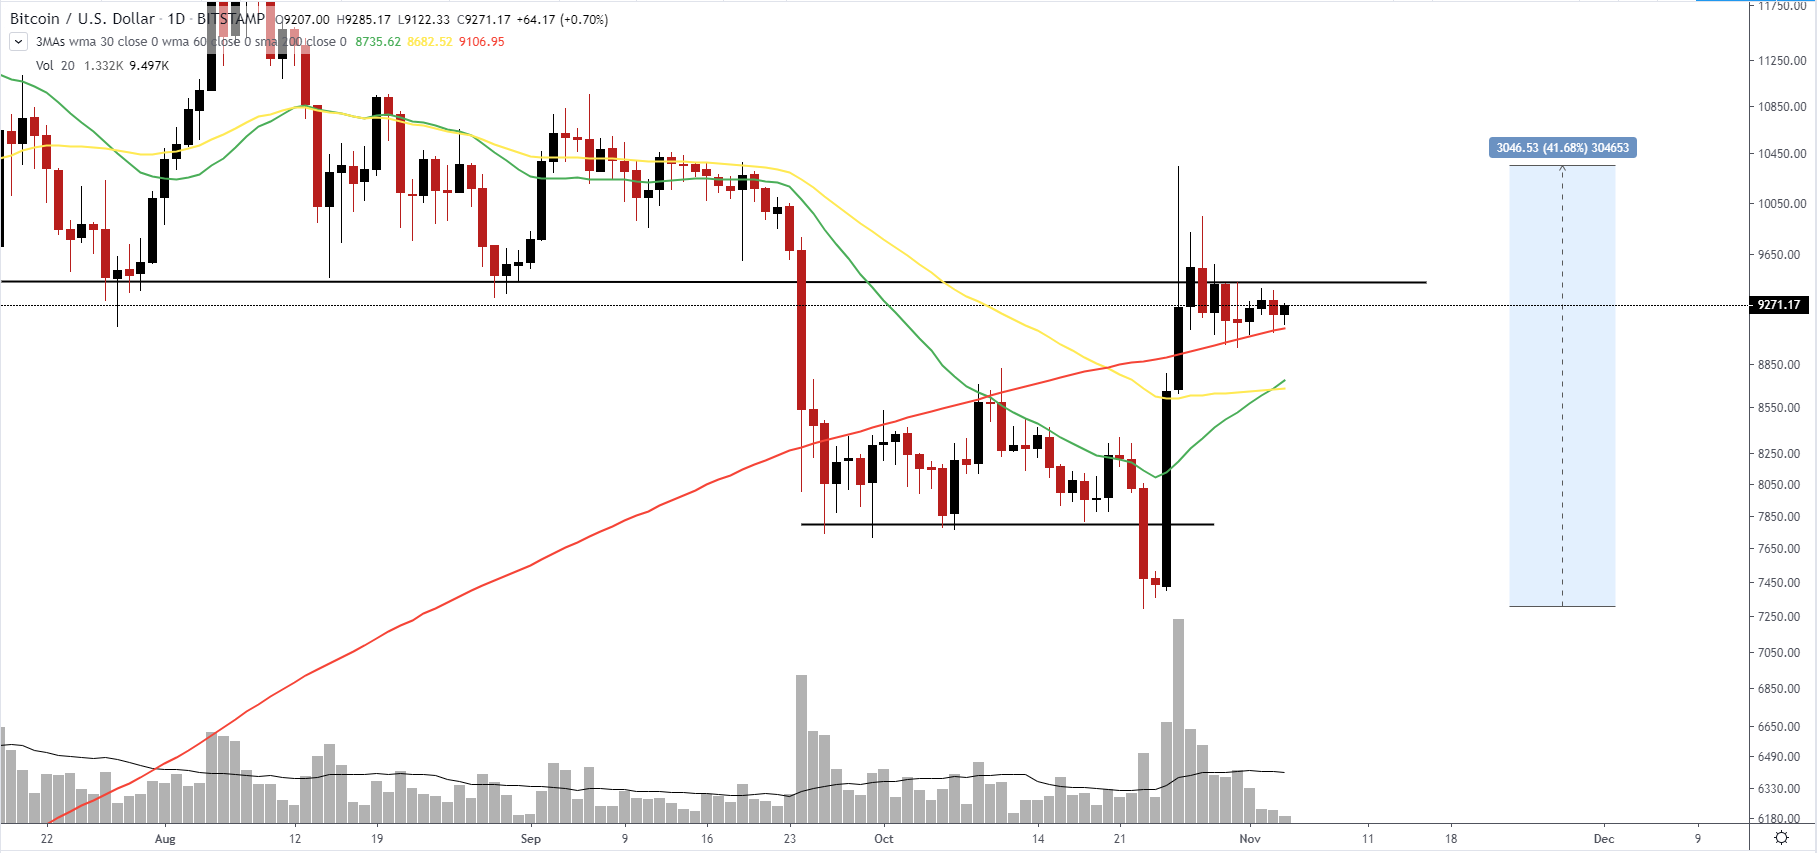
Not a simple situation here because we've got a false breakout the $7800 level and after more than 40% growth, plus it was accompanied by a pretty good volume, on the other hand, we are stuck under $9500 supply area and it looks like a retest.
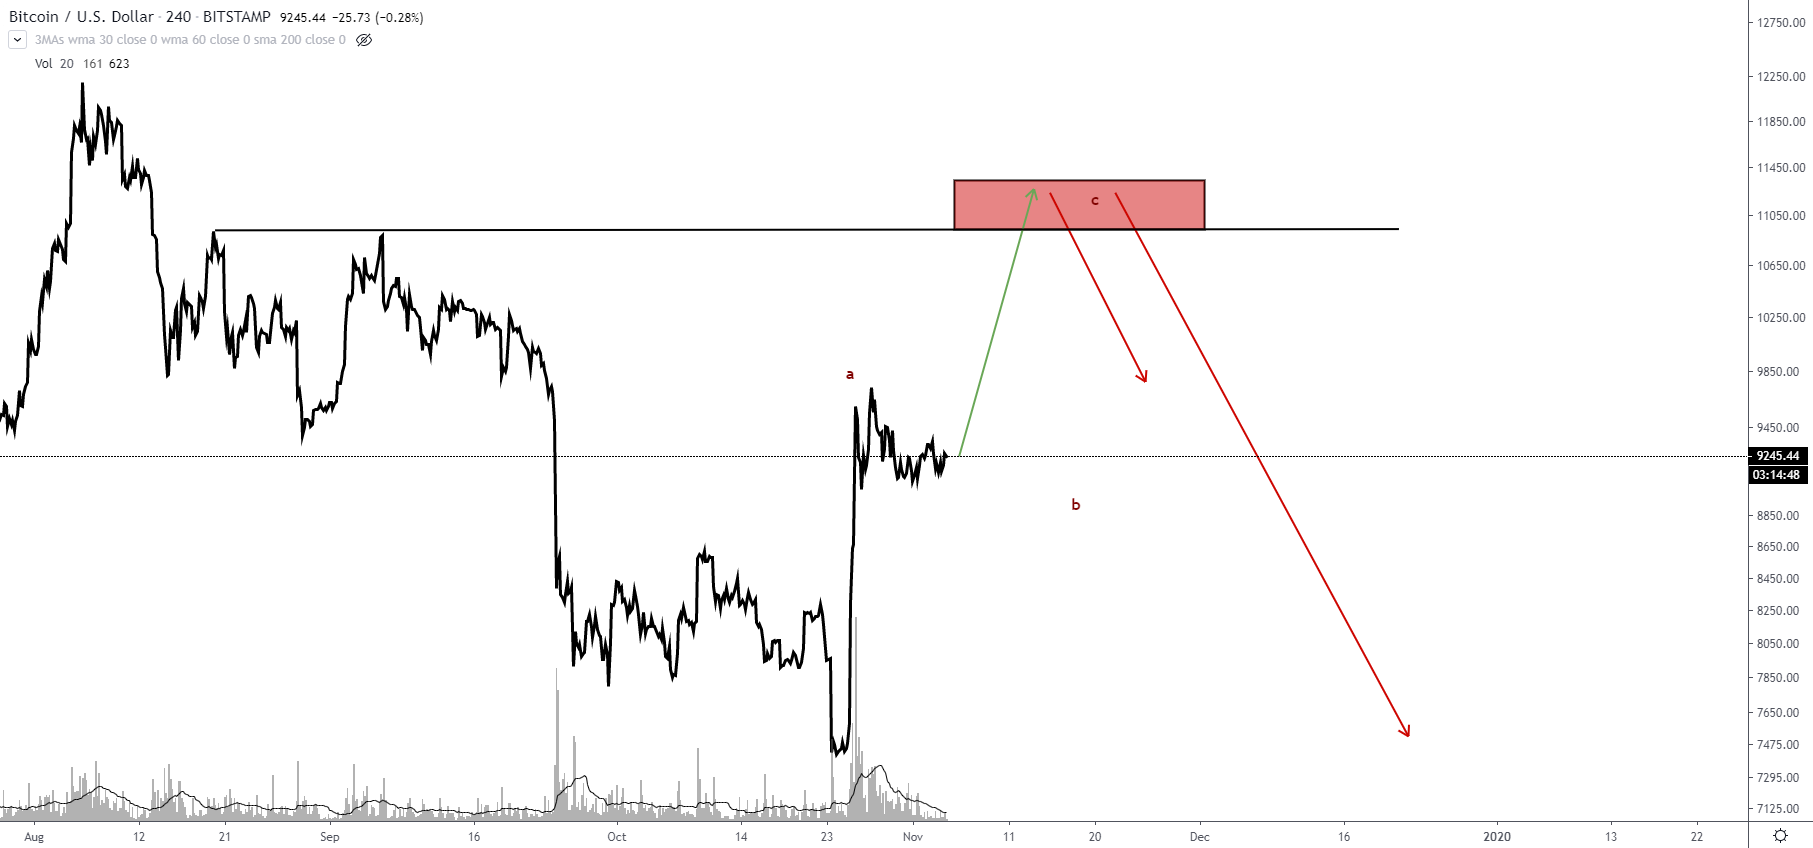
The picture will be more complicated if we recall that triangles most often occur in waves “B” in ABC correction, or as the 4th penultimate wave, therefore, if the current triangle is true and we will see growth, it seems that we are in a wave 'B' and current growth are just a correction 'ABC'. A bullish scenario is also possible if the triangle is broken down.
What about indicators, RSI holds in the bullish area and MACD also above the zero. In general, the picture looks bullish.
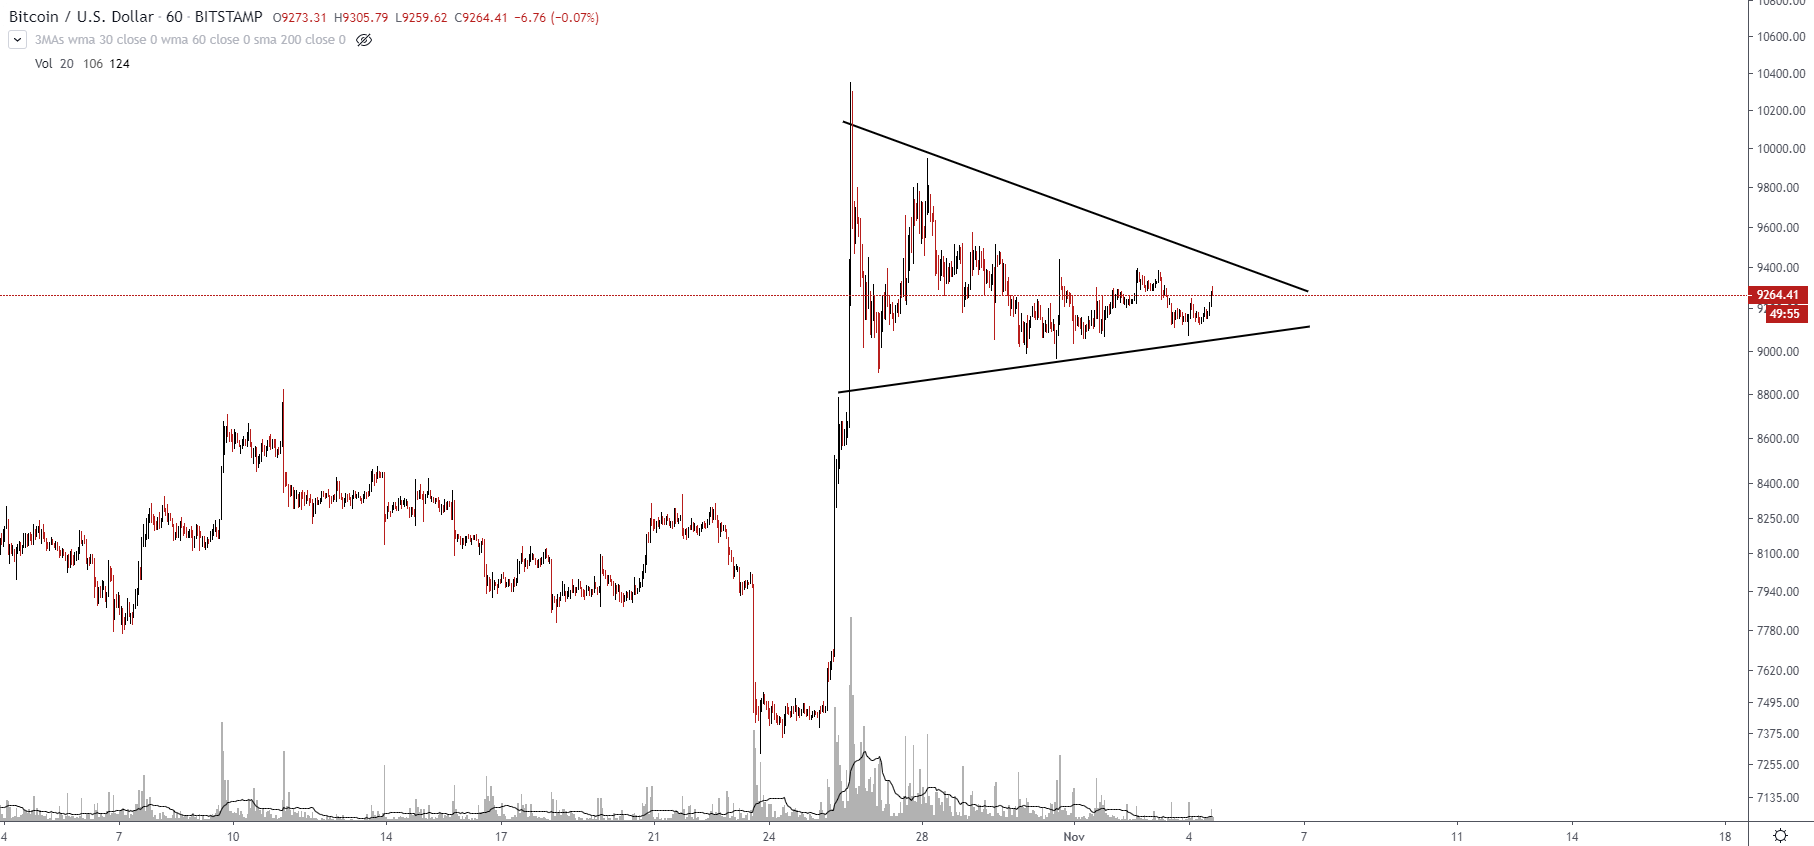
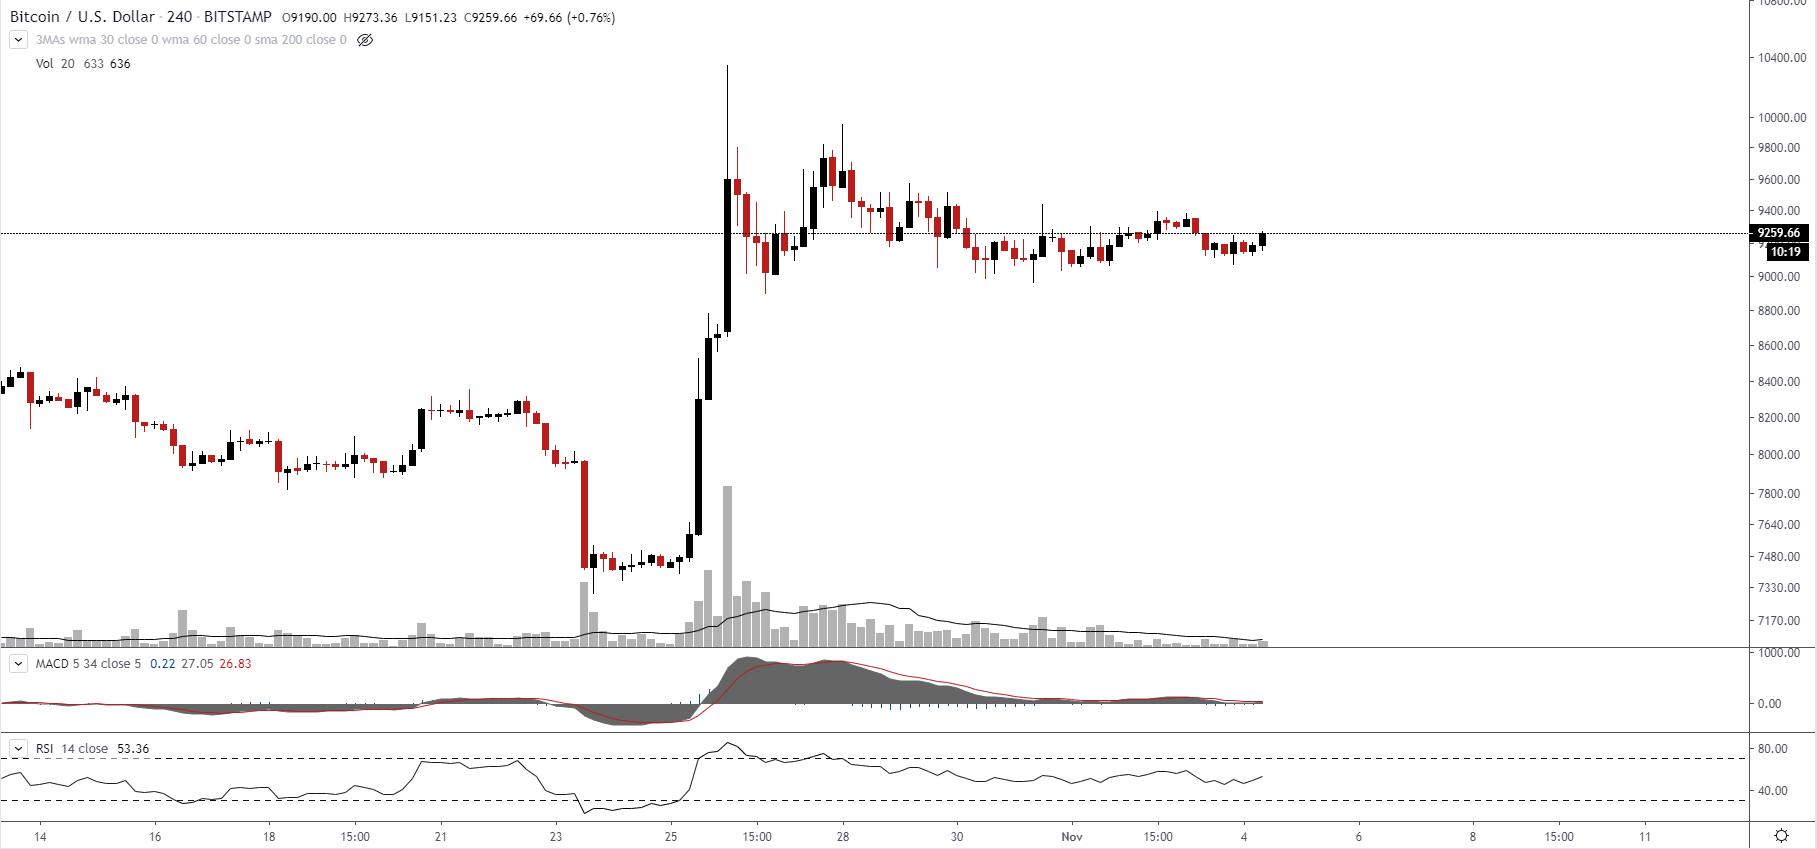
On a 4-hour scale, we do not have a very informative picture, and as mentioned earlier, the current pattern resembles a triangle, and a triangle is always 50/50.
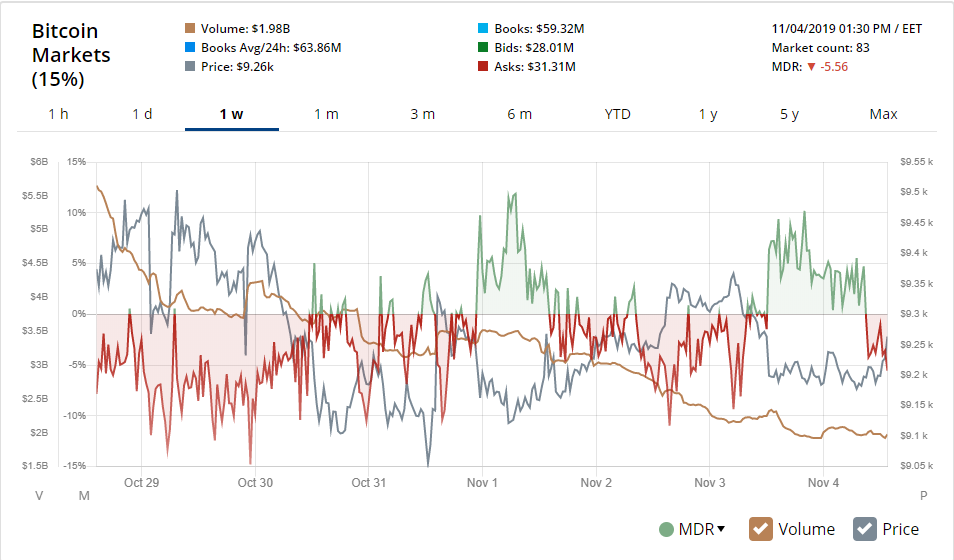
Market depth shows 'Asks' advantage and we can see a divergence between the last price movement and the volume. In general, it looks like parity.

Weekly MDR shows the parity more clearly, the only thing to pay attention is the volume which climbs down.
Conclusions:
If you are bullish
Entry - $ 8600 area, stop - $7290, take - $10950
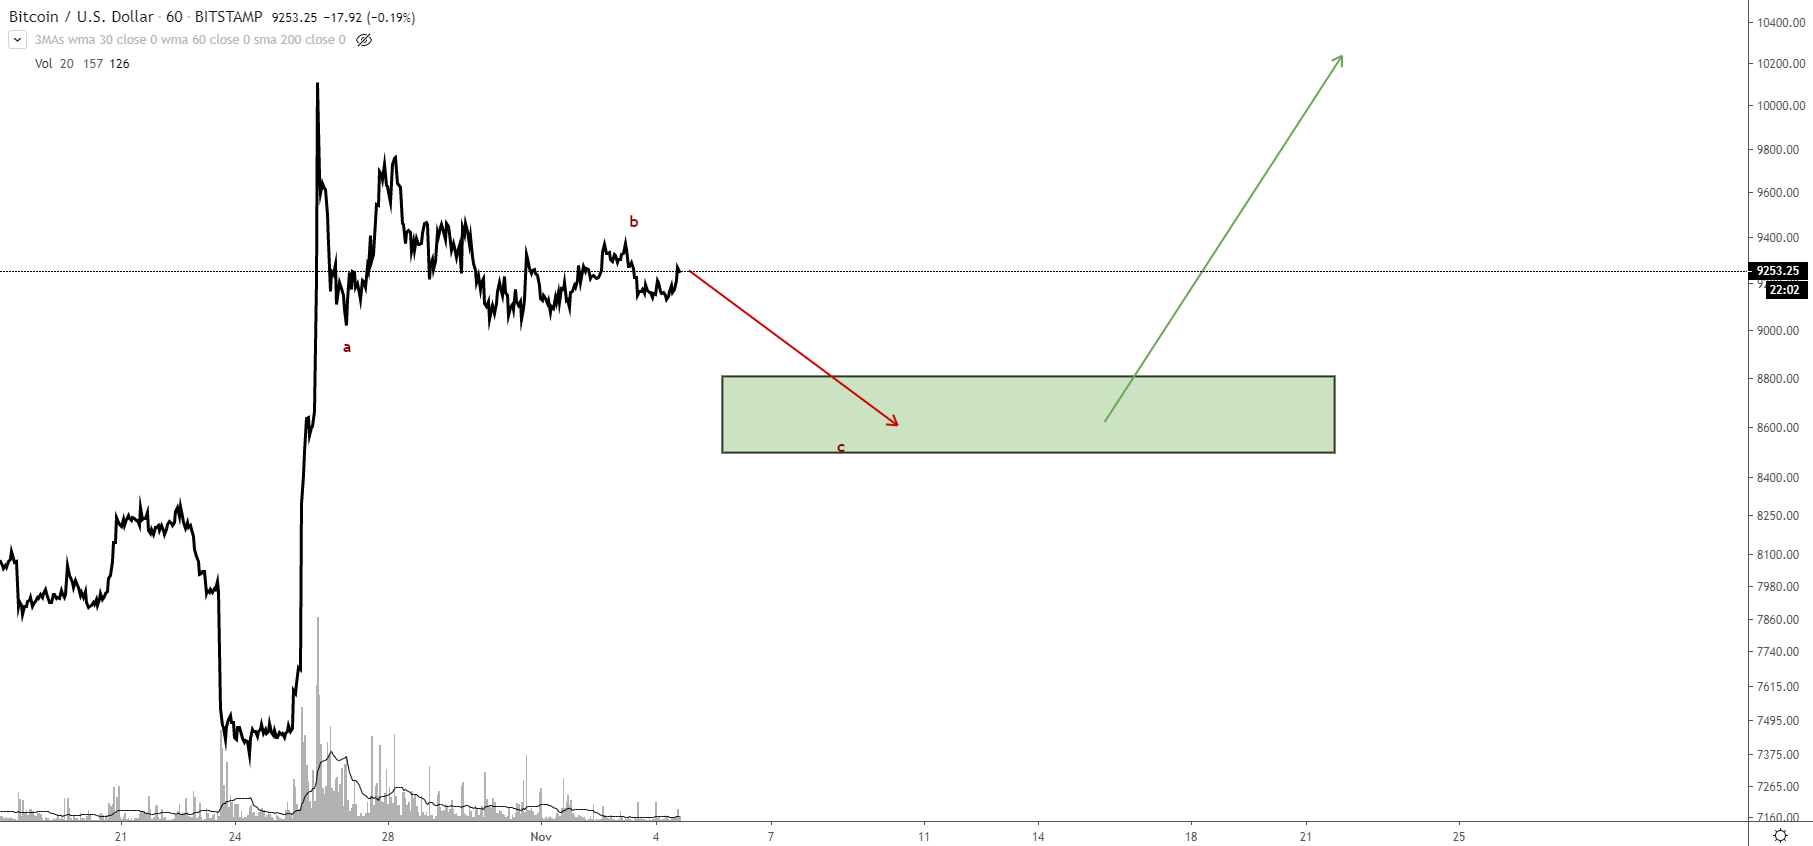
If you are bearish
Entry - $11000 (a false breakout), stop - $ (above the false breakout), take - $9750, $7500