BTC\USD
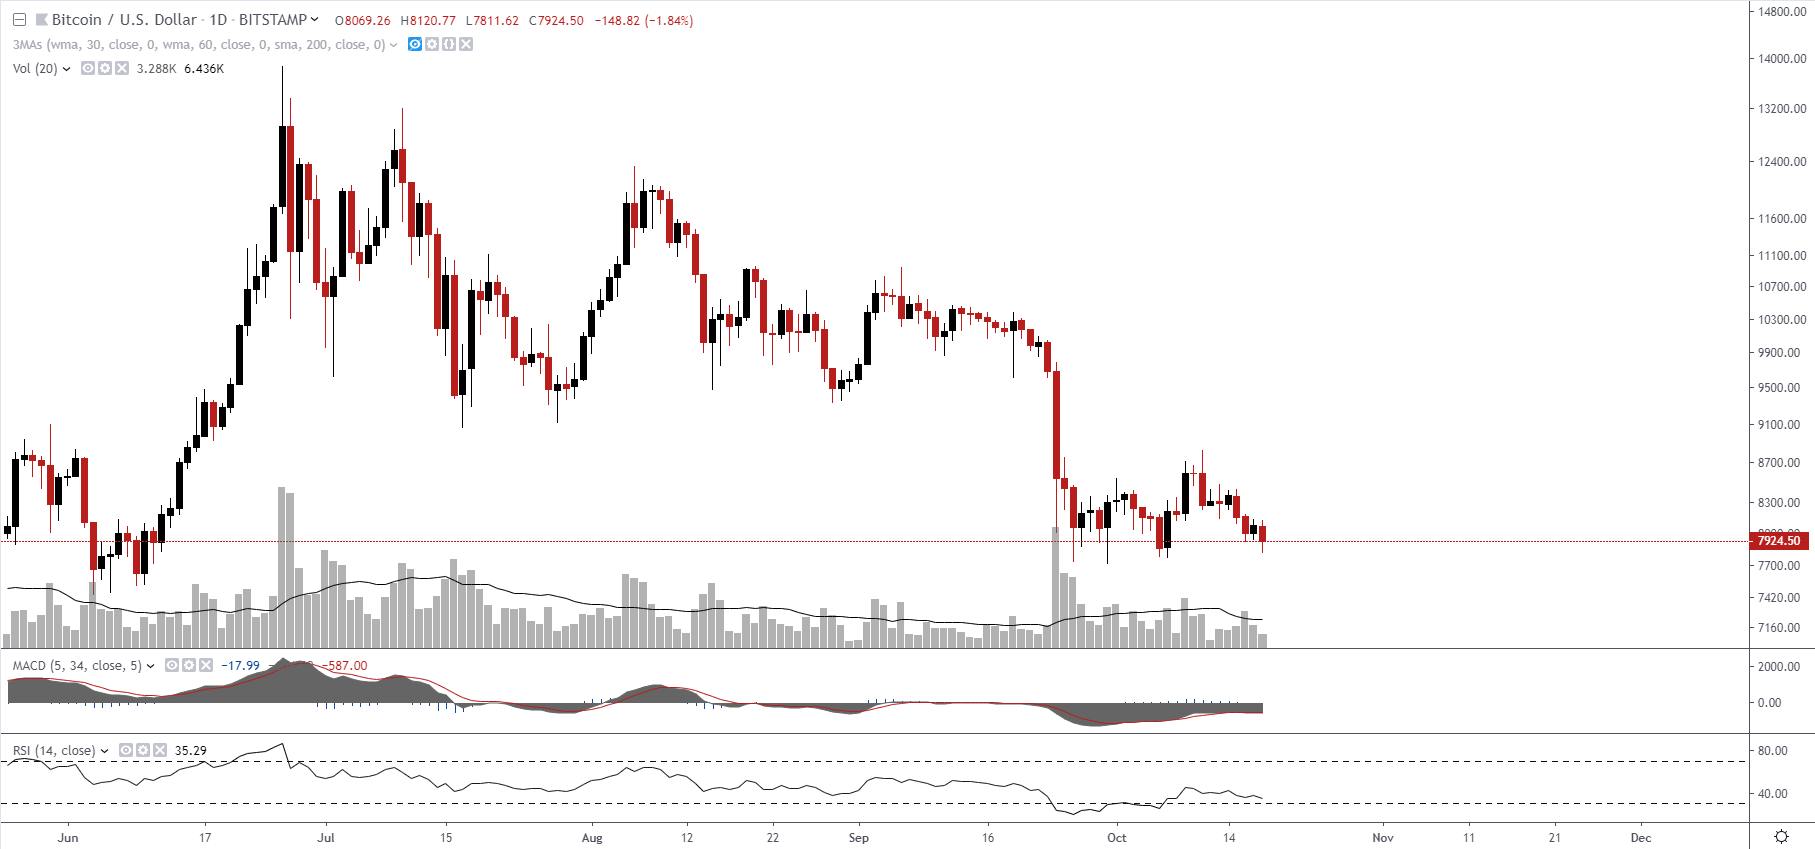
@ExratesmeHere is a daily chart Bitcoin against USD

As you can see from the chart we already have had a 'death cross' and now the 60-day moving average is about to cross the 200-day MA and the price will be below all them.
RSI holds in the bearish zone but MACD shows a divergence within a framework of the current consolidation. So we have some possibility to see some growth exactly from the current levels.
Let's try to see a possible conformation of the growth from the current levels with the Elliotte waves theory. Below on screenshot, you going to see that correction from the local high (which is $14k ) started as a zig-zag, it means this is exactly correction, not a trend change.
If exactly this scenario is correct it means we are going to see the growth exactly from these levels.
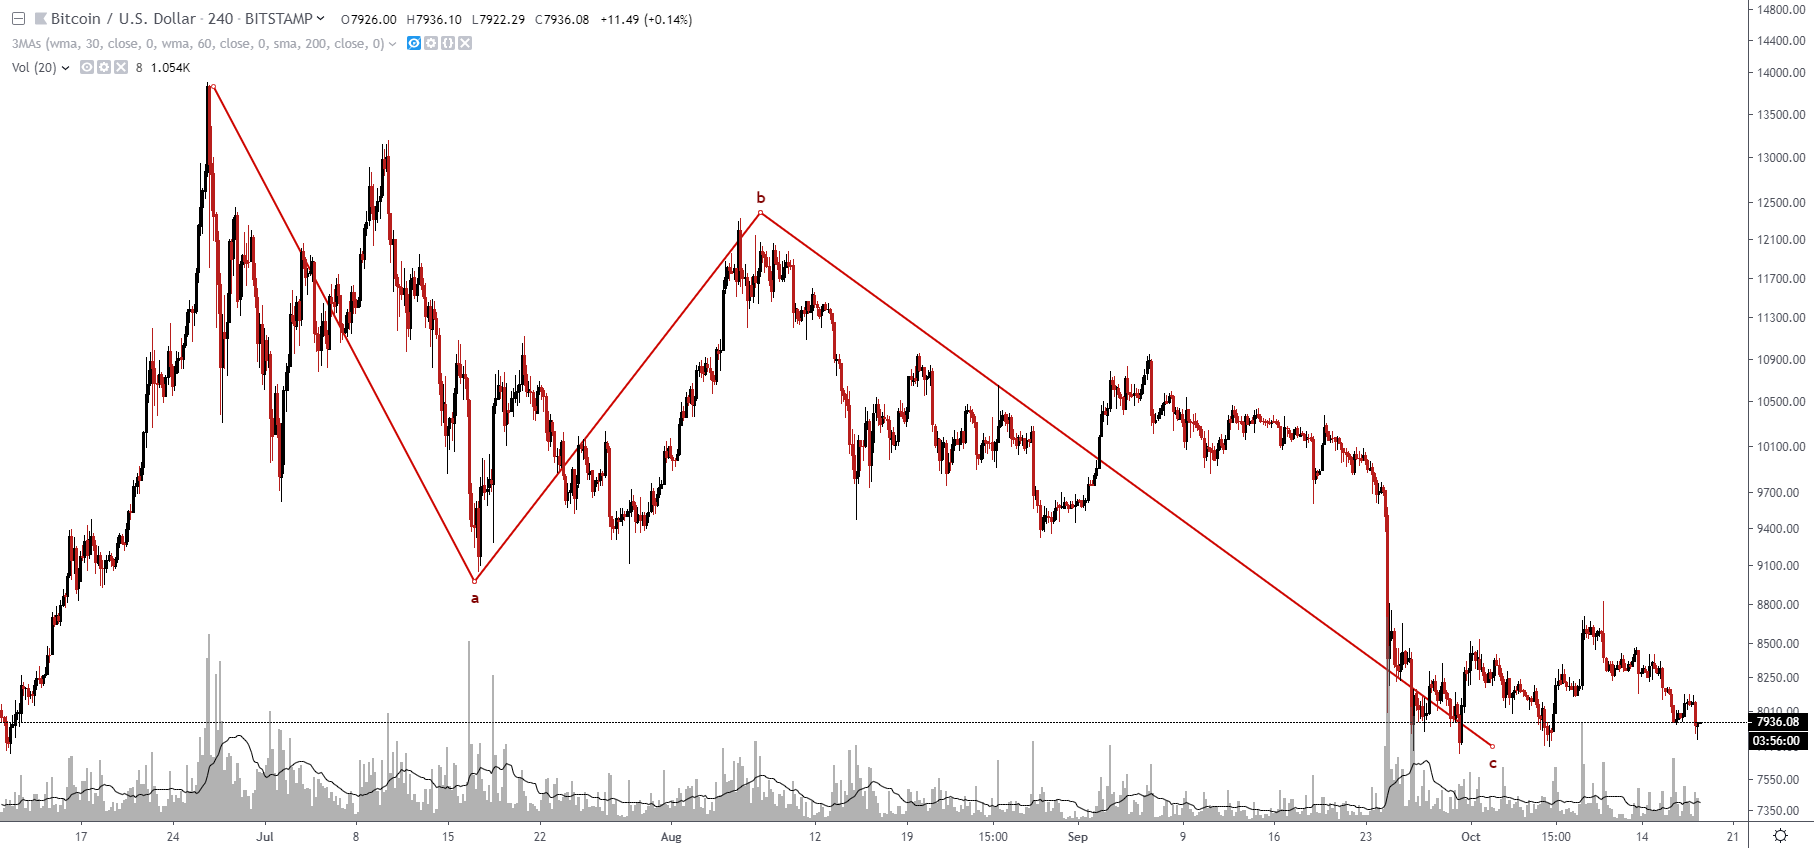
But we have one more option for a correction like this type and it might be looks like that. It is almost the same but we didn't see the last impulse down.

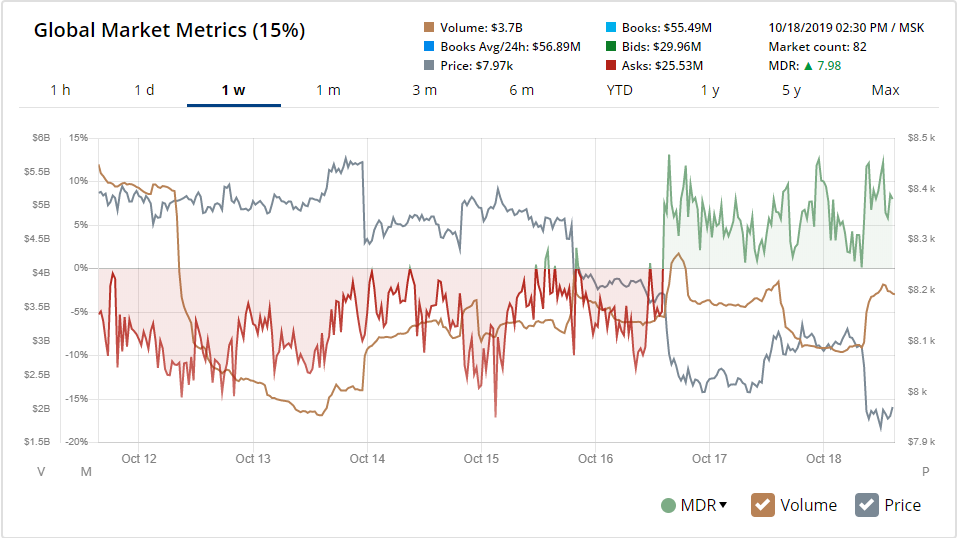
Market depth shows strond 'Bids' advantage up to 8% it is around 6 million in Bitcoin case. Plus we can see how volume raises when the price dived down.
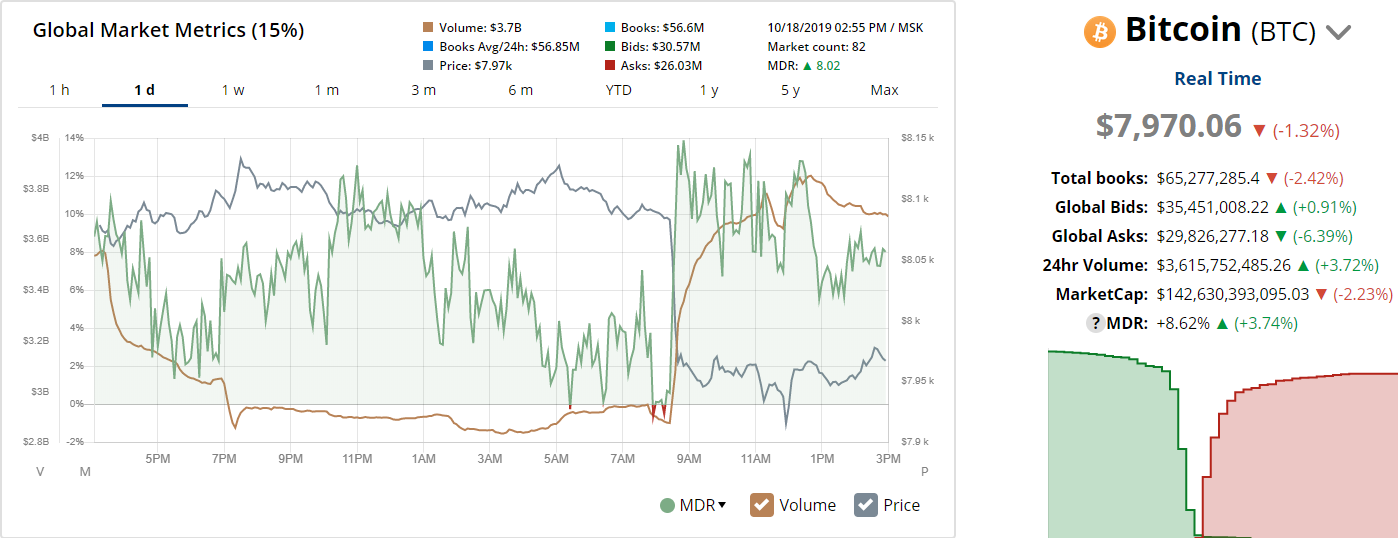
Weekly MDR is not as positive as the daily. We clearly see the negative price tendency and only since 17 Oct., we can recognize some prerequisites for change that bearish picture.
Conclusions:
If you are bullish
Entry - $7000 area, stop - $4900, take - $9700, $11600, $1390
The second option is a false breakout of the $7800 level which is safer or to buy when the price breaks the $8800 level.

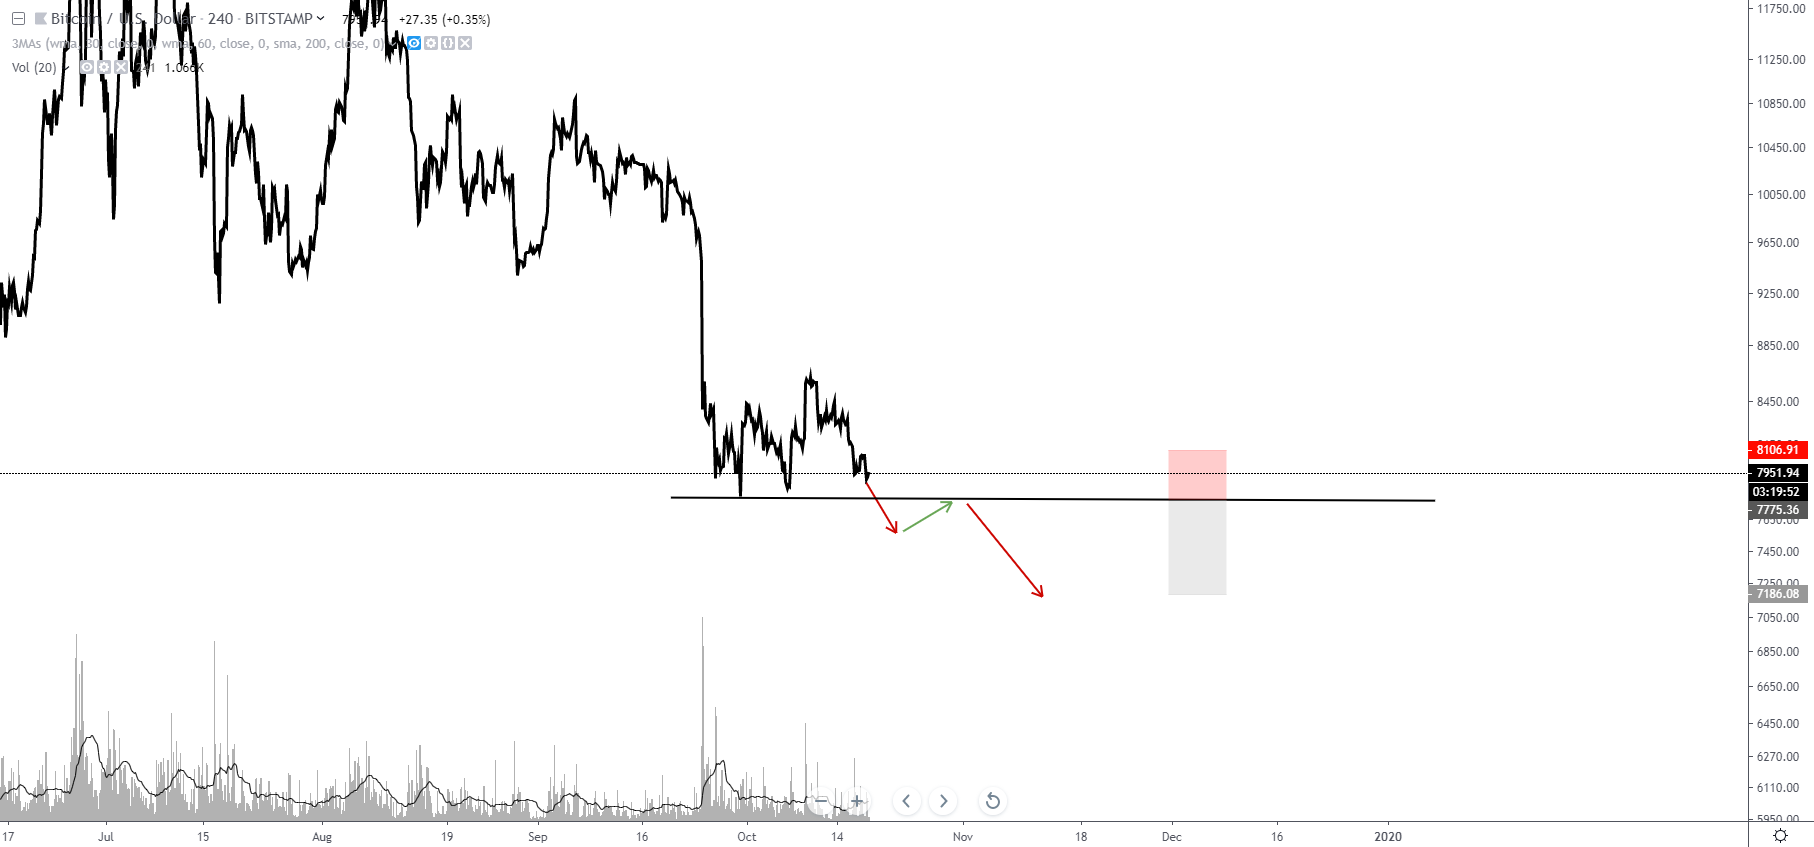
If you are bearish
Entry - $7780, stop - $8100, take - $7200