BTC\USD
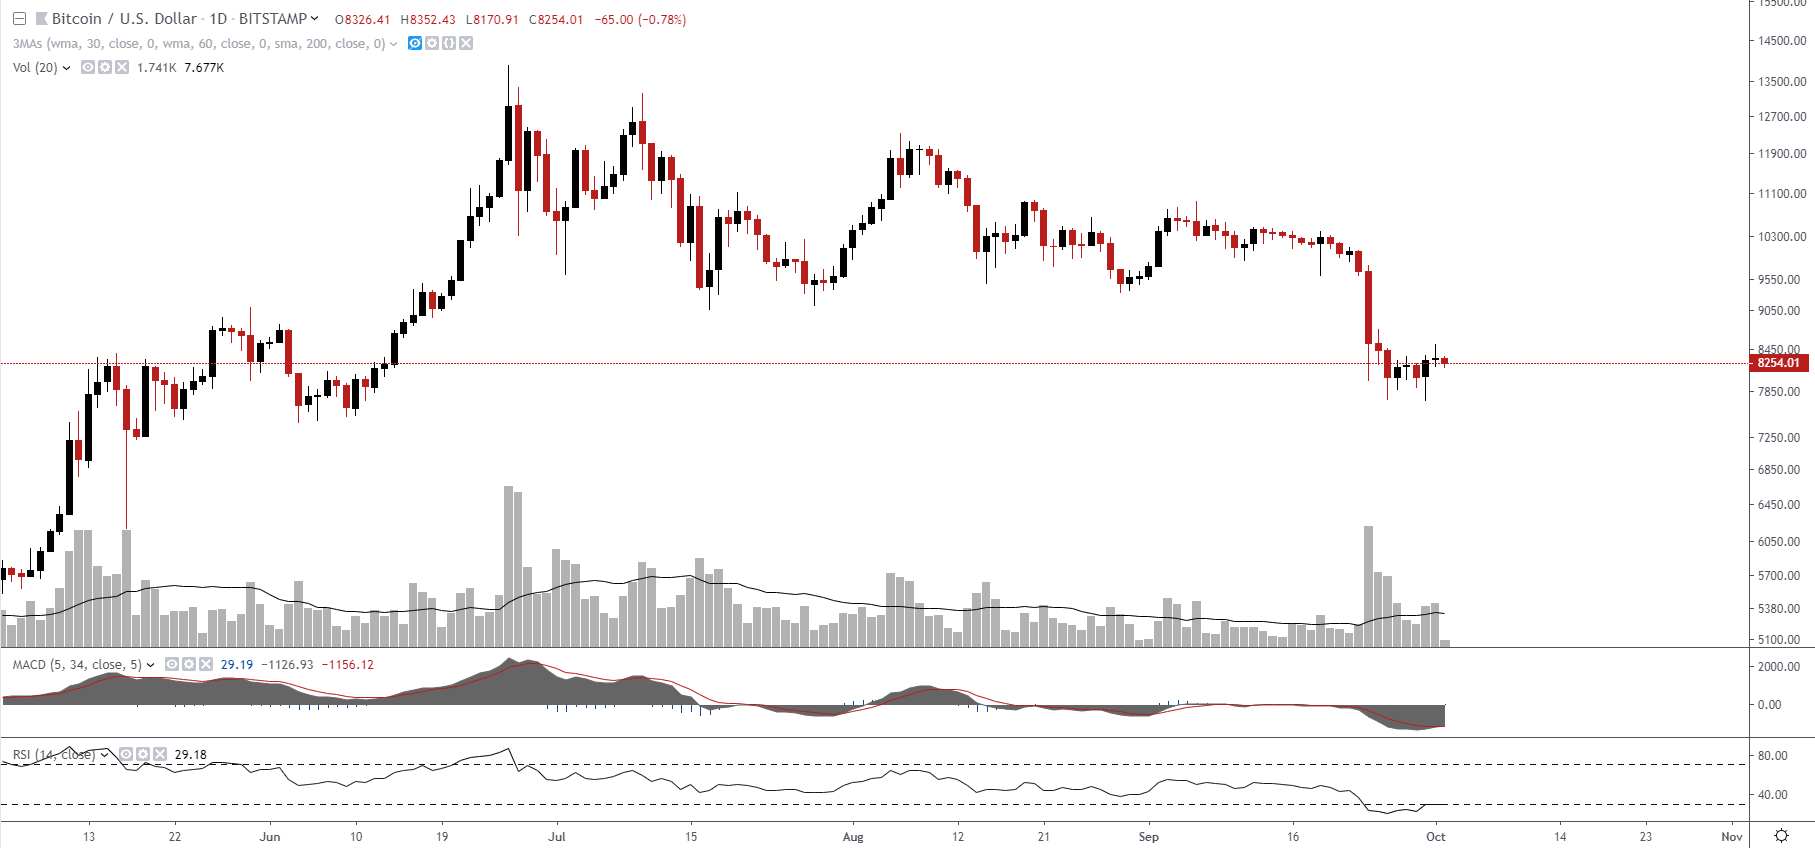
@ExratesmeHere is a daily chart Bitcoin against USD

As you can see from the chart the price is holding below the 200-day moving average and the drop after 3 months consolidation was accompanied a pretty good volume, so now it looks definitely bearish.
What about indicators, RSI is trying to jump out from the oversold zone and MACD signal line is not even separated yet.
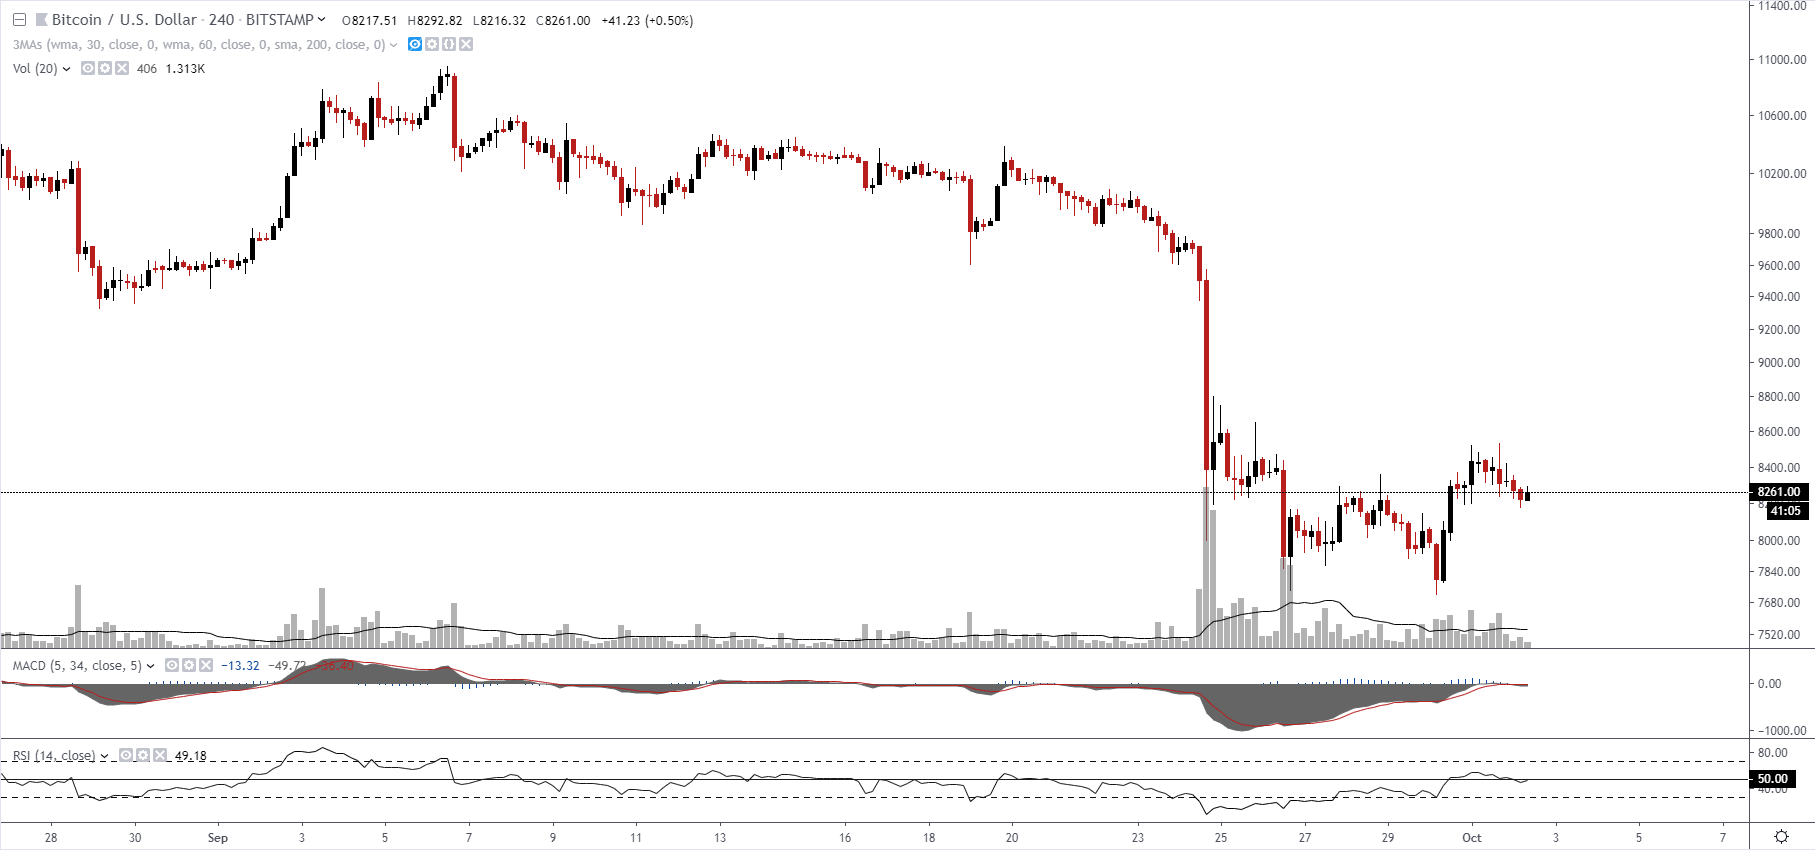
On the 4 hr chart, RSI is struggling with the 50th level and MACD also is around zero. And here the situation doesn't differ a lot and looks like a classic pattern 'move - consolidation - move'.
Market depth shows that the situation is under the bears' control. "Asks' advantage around 5%, but the volume is reducing.

Weekly MDR looks like consolidation and here is nothing to add except the situation in general shows no signs to buy at all which is could be used against the majority.

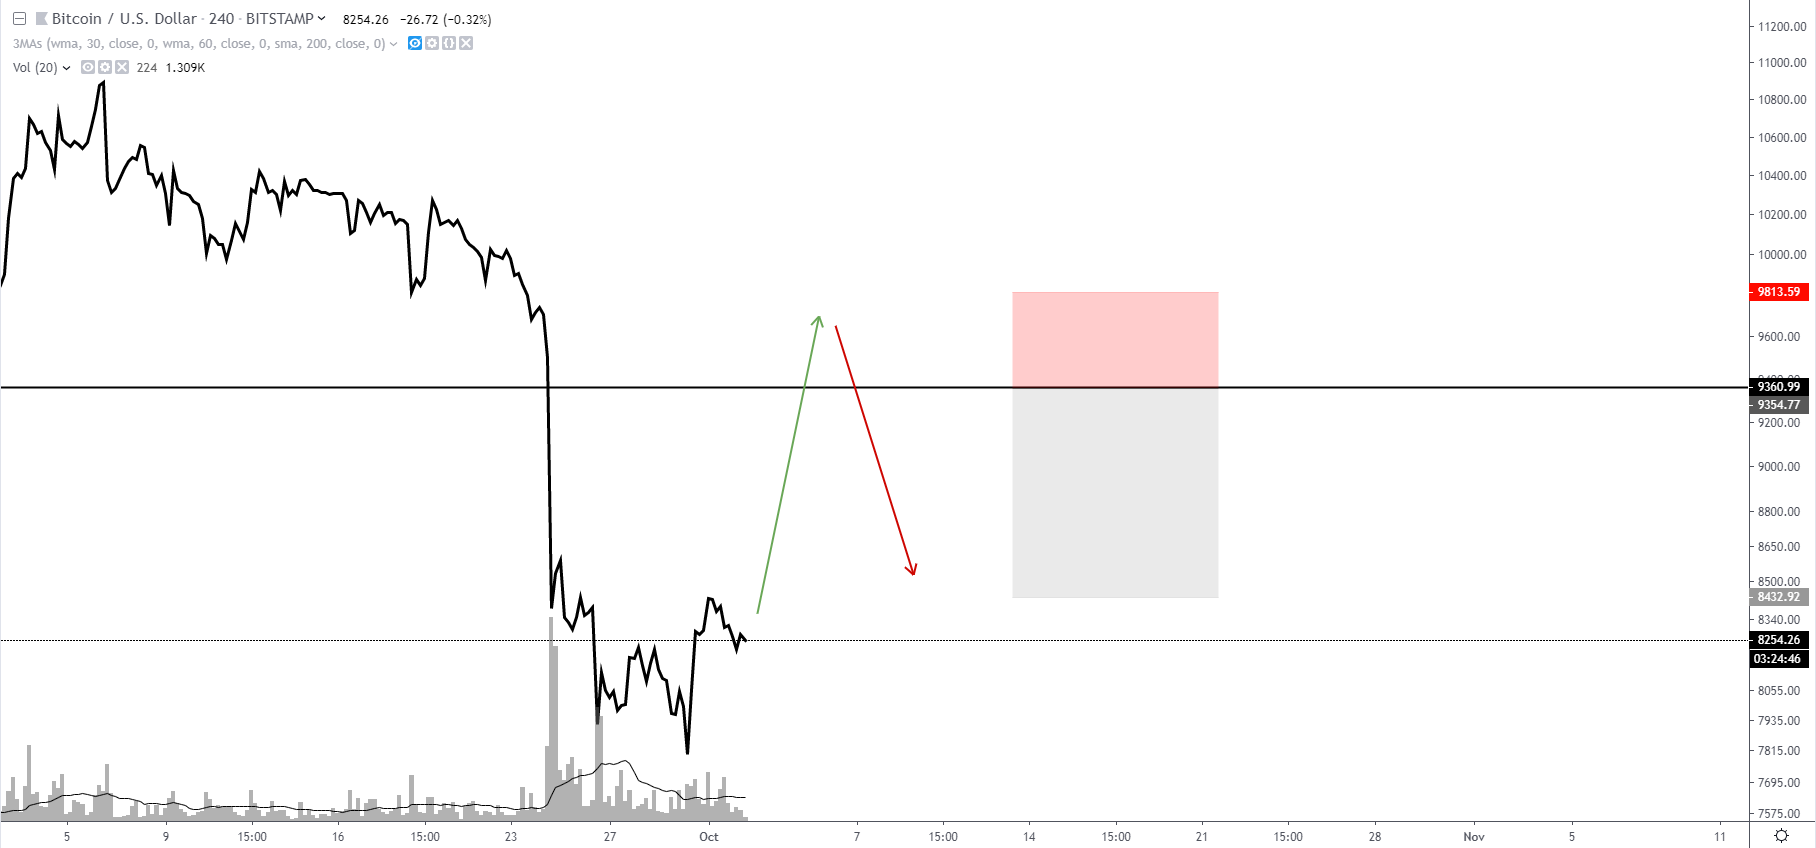
Conclusions:
If you are bullish
Entry - $8500, stop - $7900, take - $9300

If you are bearish
Entry - $9400 (a false breakout), stop - $9801(above the false breakout), take - $8500