BTC\USD
@ExratesmeHere is a daily chart BTC against USD

The price already holds below 30-day and 60-day moving averages and the first is about to cross the second. The next demand area is exactly around the 200-day moving average but before that scenario let's take back to our triangle where we did our swing trade and that worked perfectly.

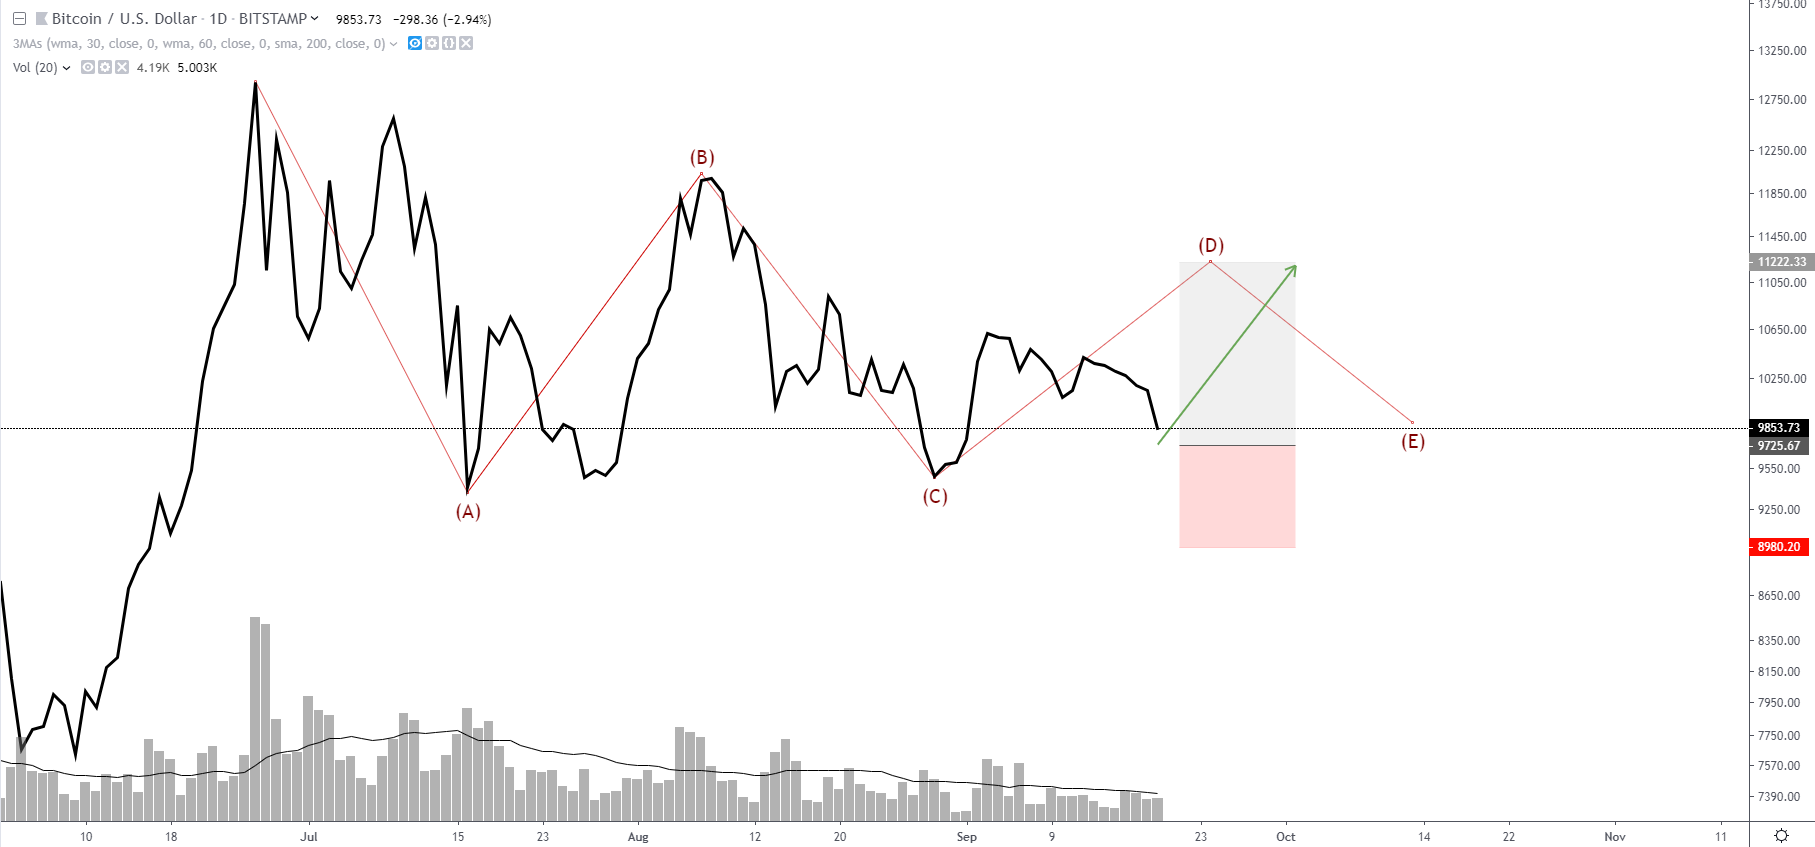
If we believe in the Elliotte waves theory we know that triangles are penultimate patterns, it means we have the most likely possibility to see how the triangle will be broken up. Also, we know that if the triangle is true, we can't see the price lower than 'C' it means if it happens we will be prepared and be ready of the breaking the $9300 support.
What about indicators, RSI failed a try to get above the 50th level and MACD holds below the zero.

On the 4 hr scale, the situation is different. RSI in the oversold zone and MACD shows a divergence. In conjunction with the triangle, it is a good entry point. But of course, it looks bearish if we look at the price behavior.
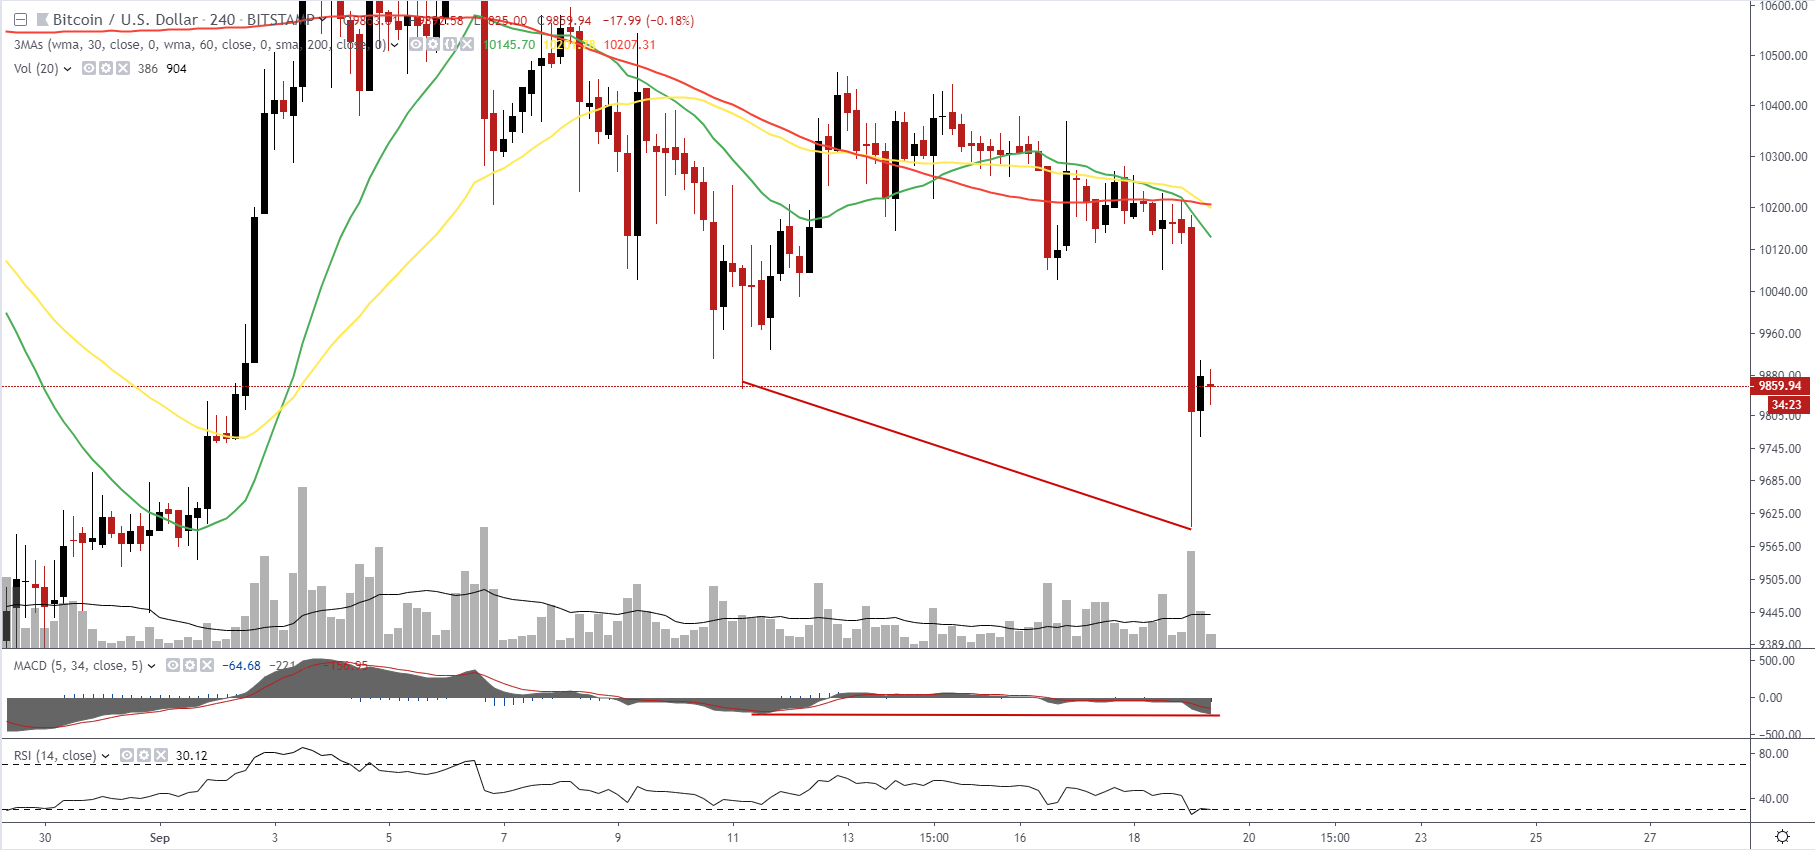
Market depth has 'Asks' advantage. The interesting thing here is that price drop which accompanied with pretty good volume.

Weekly MDR shows a sad picture and here it looks definitely bearish. On the other hand, the price holds the $9300 level for four months not matter that pressure.

Order books sorted by liquidity. And the only Bitfinex shows 'Bids' advantage. But 'Asks' advantage stays as a fact here.

Conclusions:
If you are bullish
The first option: Entry- $9700 area, stop - $8150, take - $12900

The second option if the triangle will be extended: Entry - $9700, stop - $8900, take - $11200
The third option: Entry - $11000, stop - $10500, take - $11800, $12200, $13700

If you are bearish
Entry - $9000, stop - $9800, take - $7500
