BTC\USD
@ExratesmeHere is a daily chart BTC against USD

The price is struggling with the 30-day and 60-day MAs if it is going to hold above those MAs lots of market participants will see additional signals for buys.
Also, we can see a triangle here and if we believe that triangles are usually a penultimate pattern before the last impulse in the trend (our case is uptrend) we might see some up movement.

RSI on the daily scale, in the bearish area, at least for now, the signal line can't break the 50th level. MACD also holds below the zero but if the price has been pushed a little more the MAs, RSI, and MACD will be turned to bullish the same time.

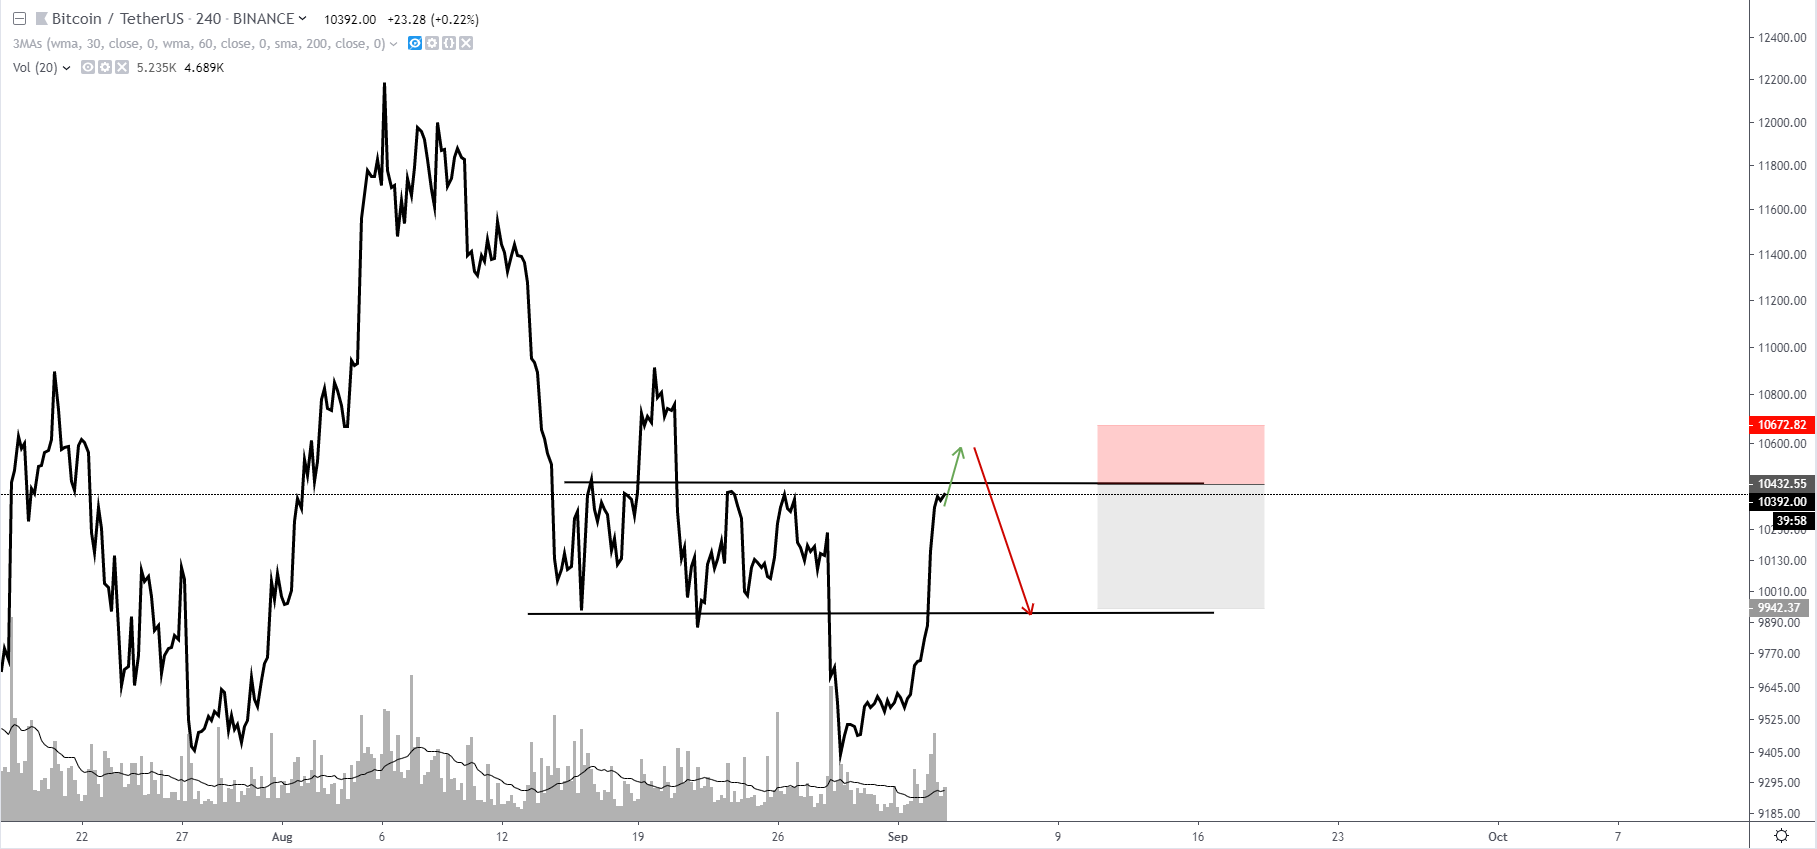
On the 4 hr scale, RSI in the overbought zone, so in the short-term, we might see some correction. MACD holds above the zero but in this case, it is not too important.

Market depth shows a parity but we clearly see the tendency from negative to positive.

Weekly MDR shows almost the same thing but what we can see here is how volume accompanies the growth which is a good sign.

Conclusions:
If you are bullish
Entry - $9900, stop - $9200, take - $10200

If you are bearish
Entry - $10400 (a false breakout will be perfect), stop -$10670, take - $10000