BCH/USD
@ExratesmeHere is a daily chart BCH against USD
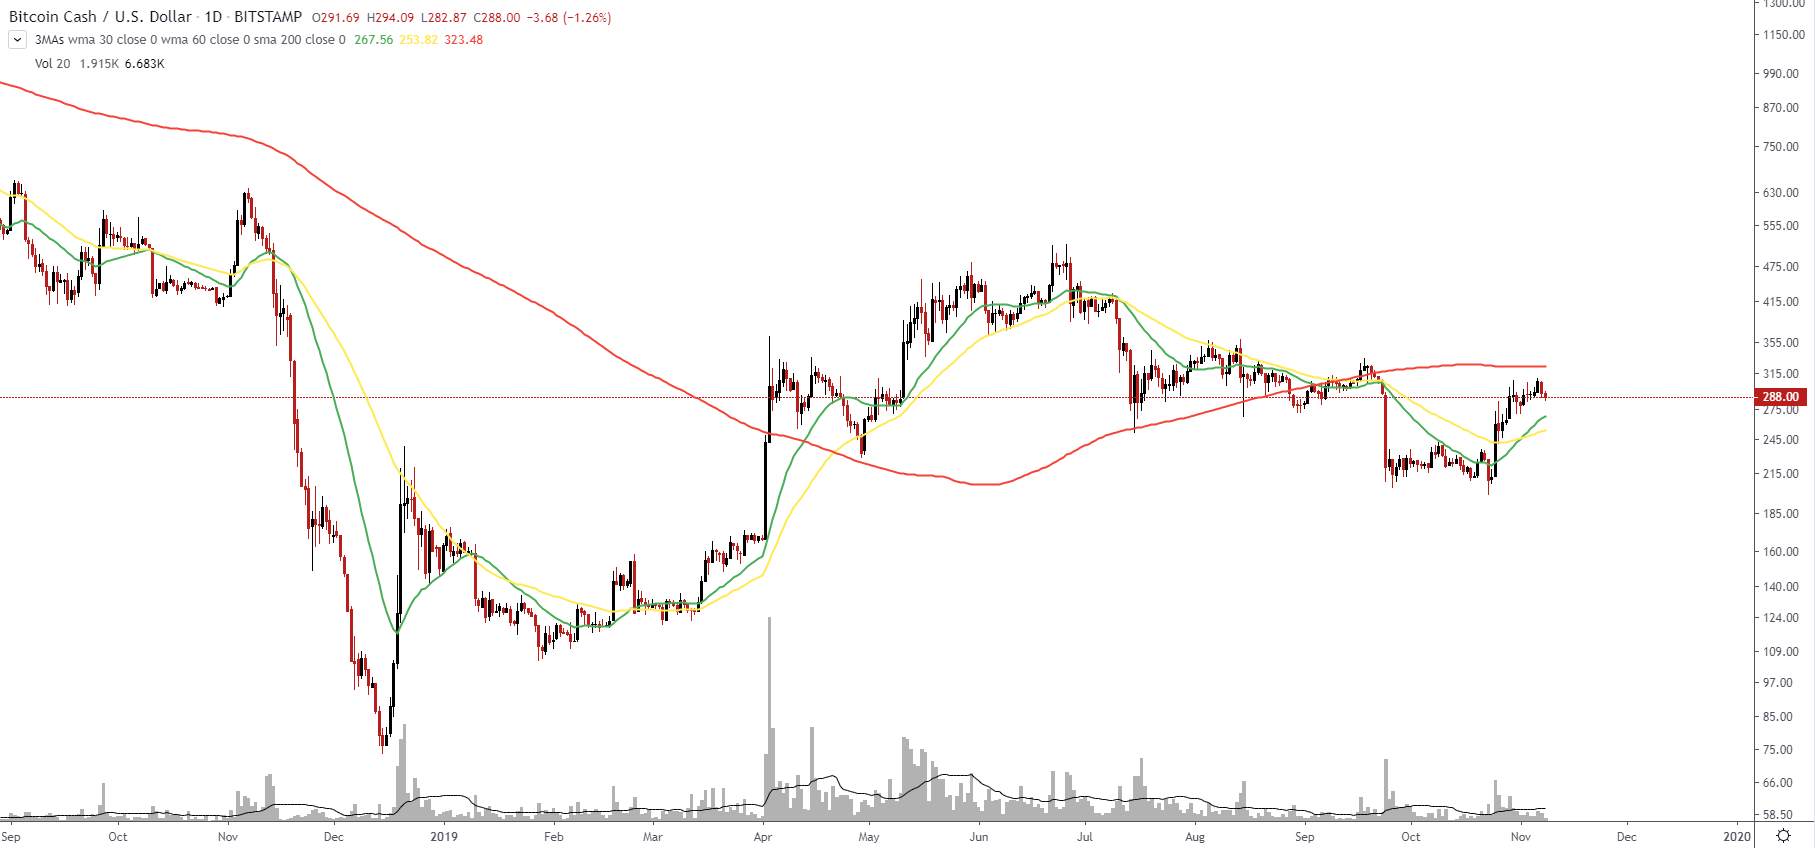
The price is between 200-day and a combination of 30-day 60-day moving averages. It would be nice by the efforts of the bulls to allow the price to rise above the 200-day moving average to show its strength, because now it looks like a retest of the supply area, and then we will continue to decline.
As for the indicators, the RSI is about to enter the overbought zone, but the MACD looks good, it is above zero and the signal line is not even divided.

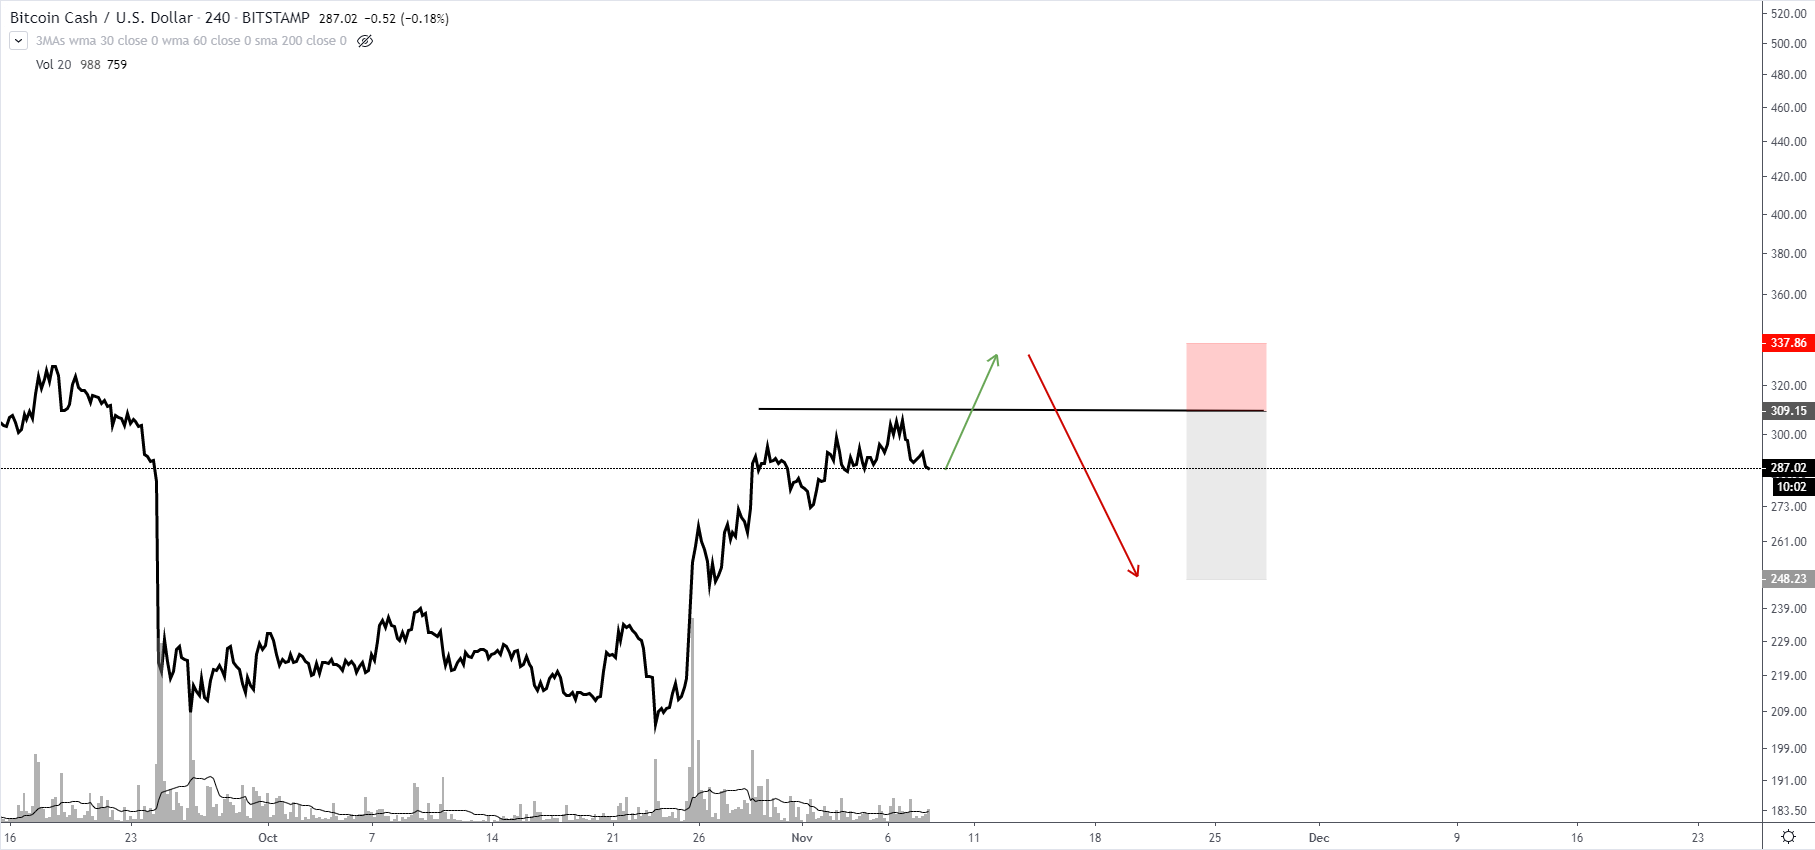
On the 4 hr scale, the situation more bearish. We can see MACD divergence, plus RSI holds below the 50th level in the bearish zone. Let's see if it is time for some retracement how far is it going to get.

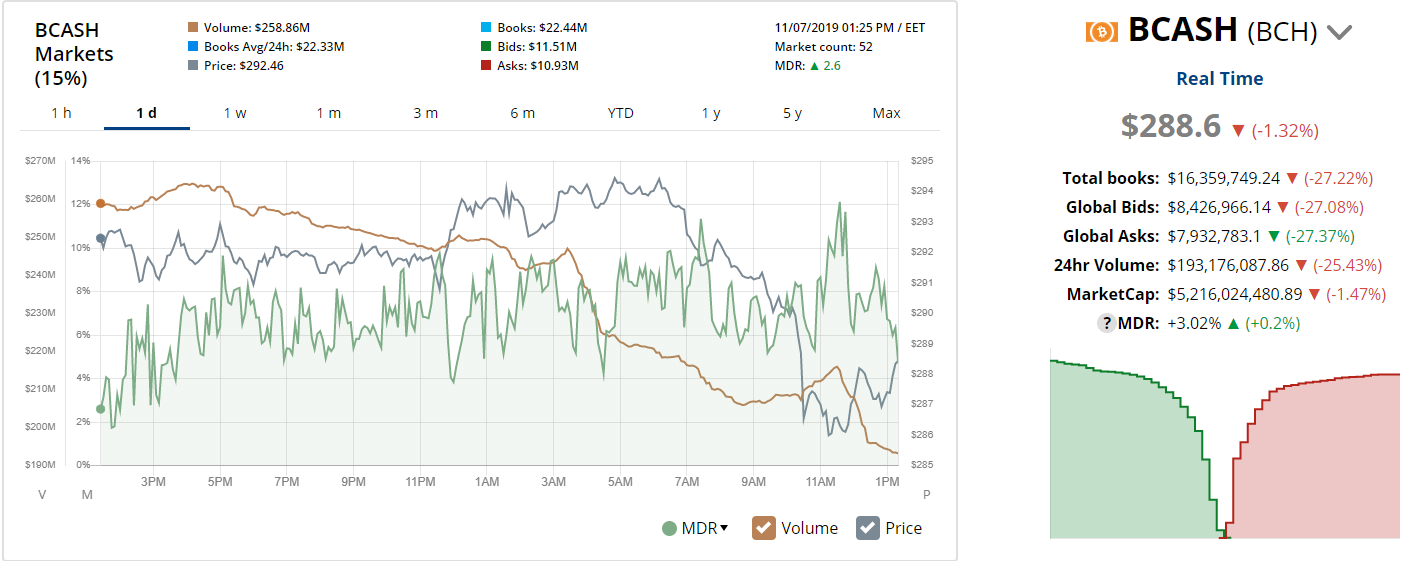
Market depth has 'Bids' advantage, but take a look at the volume, it is not the best picture for further growth, but anyway, in this case, it is more likely we just don't have any supply pressure.
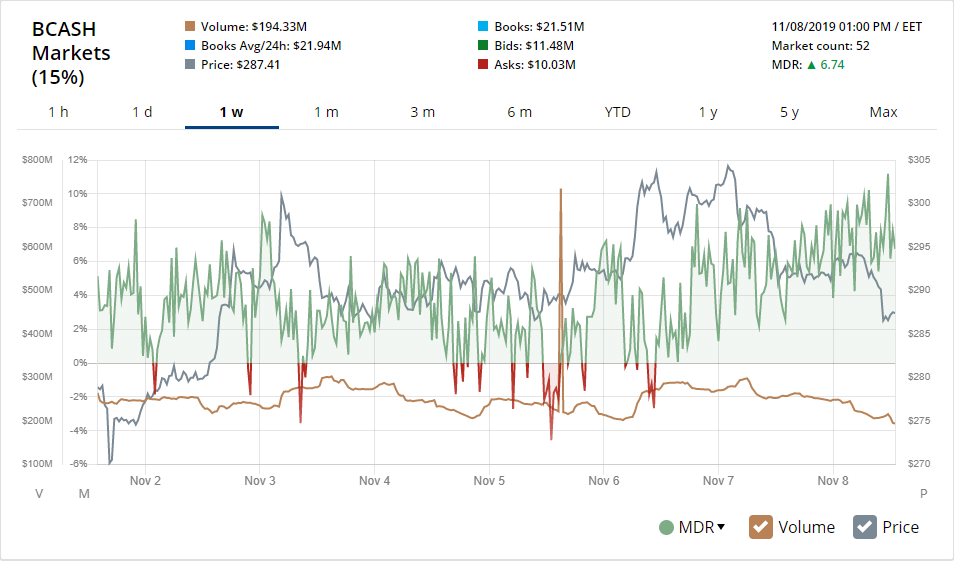
Weekly MDR looks almost the same and in general, it looks good for bulls, we have the price positive tendency and 'Bids' tendency is positive too.
Conclusions:
If you are bullish
Entry - $242, stop - $195, take - $350
The second option - $356, stop - $275, take - $500
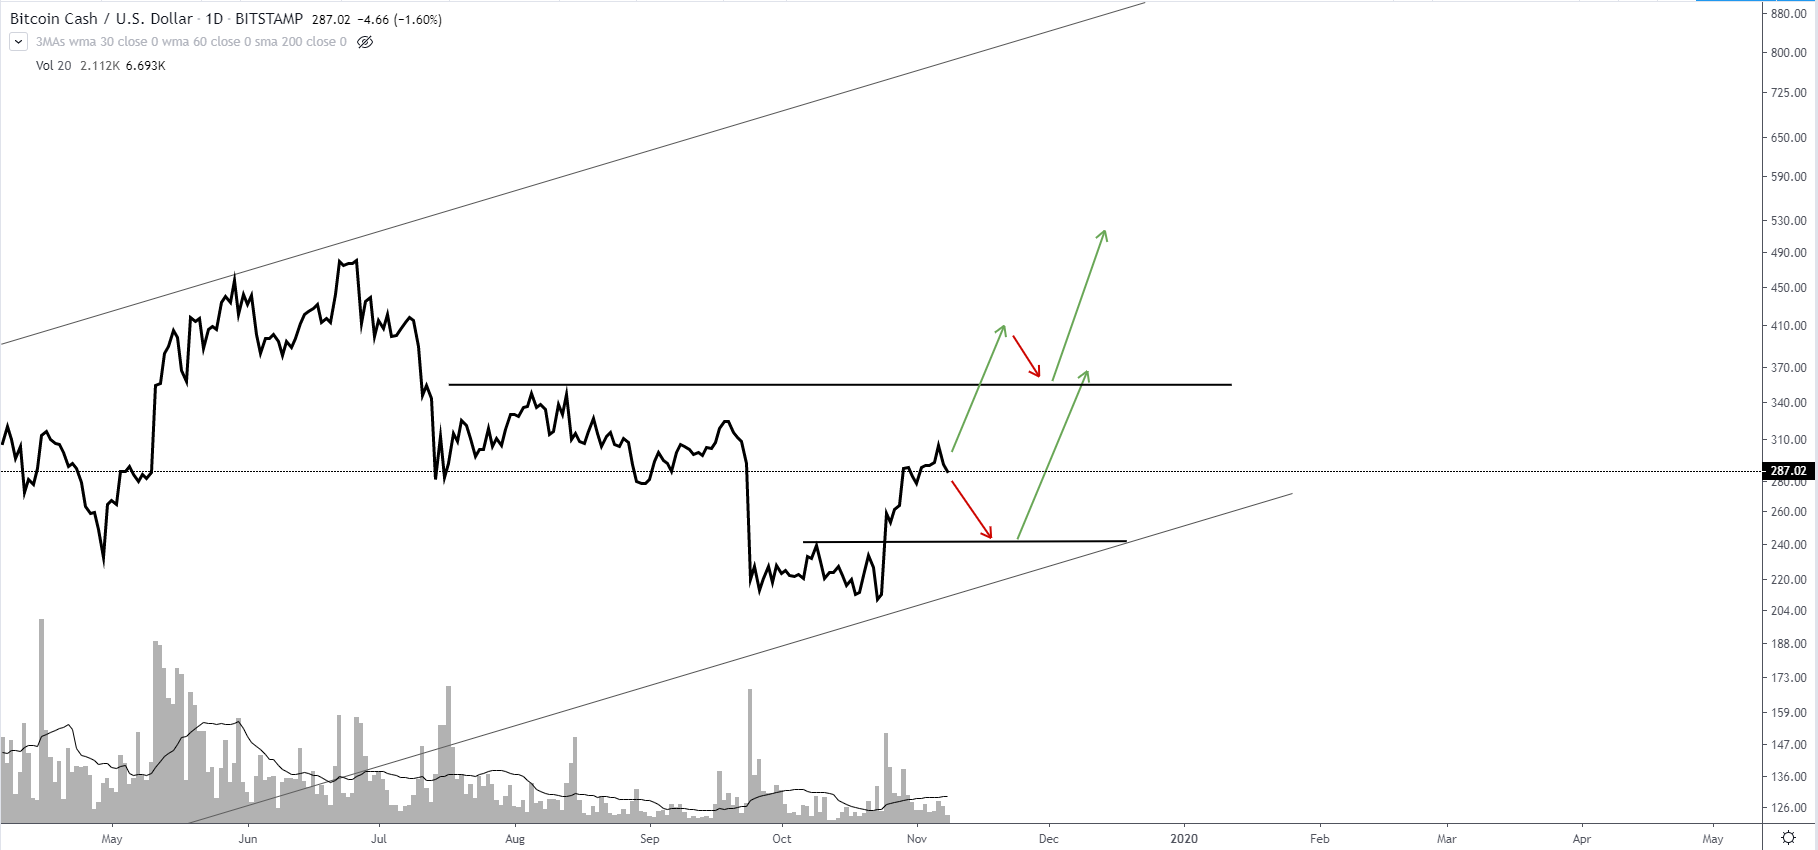
If you are bearish
Entry - $310 (a false breakout), stop - $340 (above the false breakout), take- $250