BCH/USD
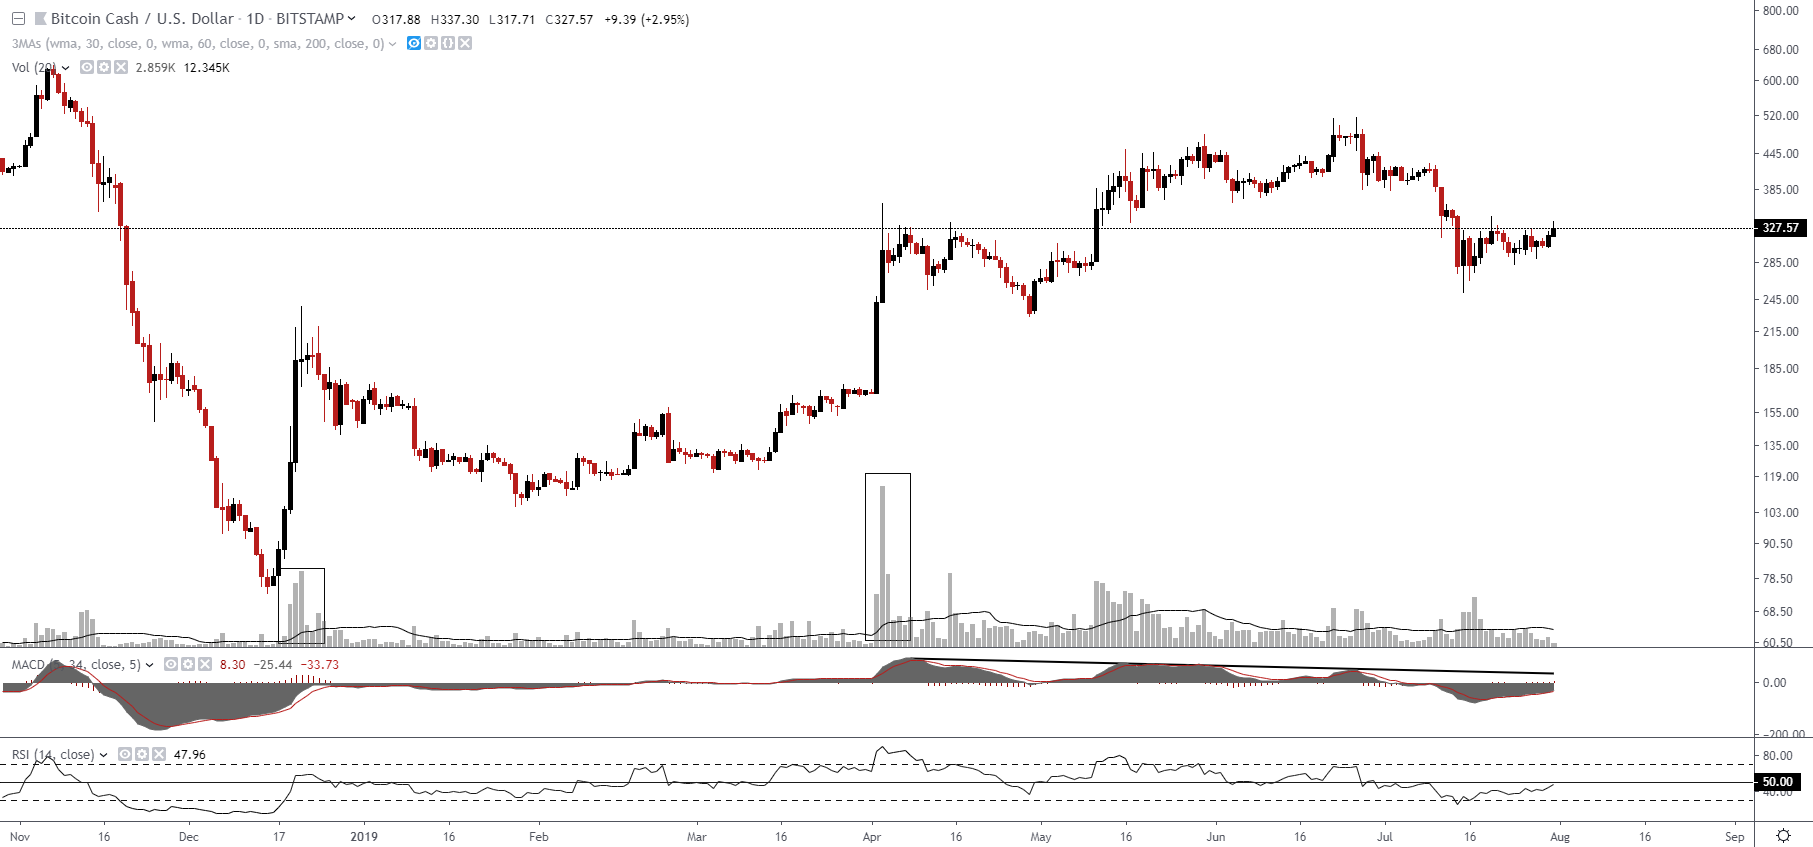
@Dmitry1gorevichHere is a daily chart BCH against USD

As you can see from the chart BCH has bounced from the 200 MA but the 30 and 60 MAs are resistance now. In general, that growth was with raised volume and now it looks like classic a 'move - consolidation - move' pattern. But indicators have turned bearish and RSI is struggling with the 50th level and MACD shows a divergence
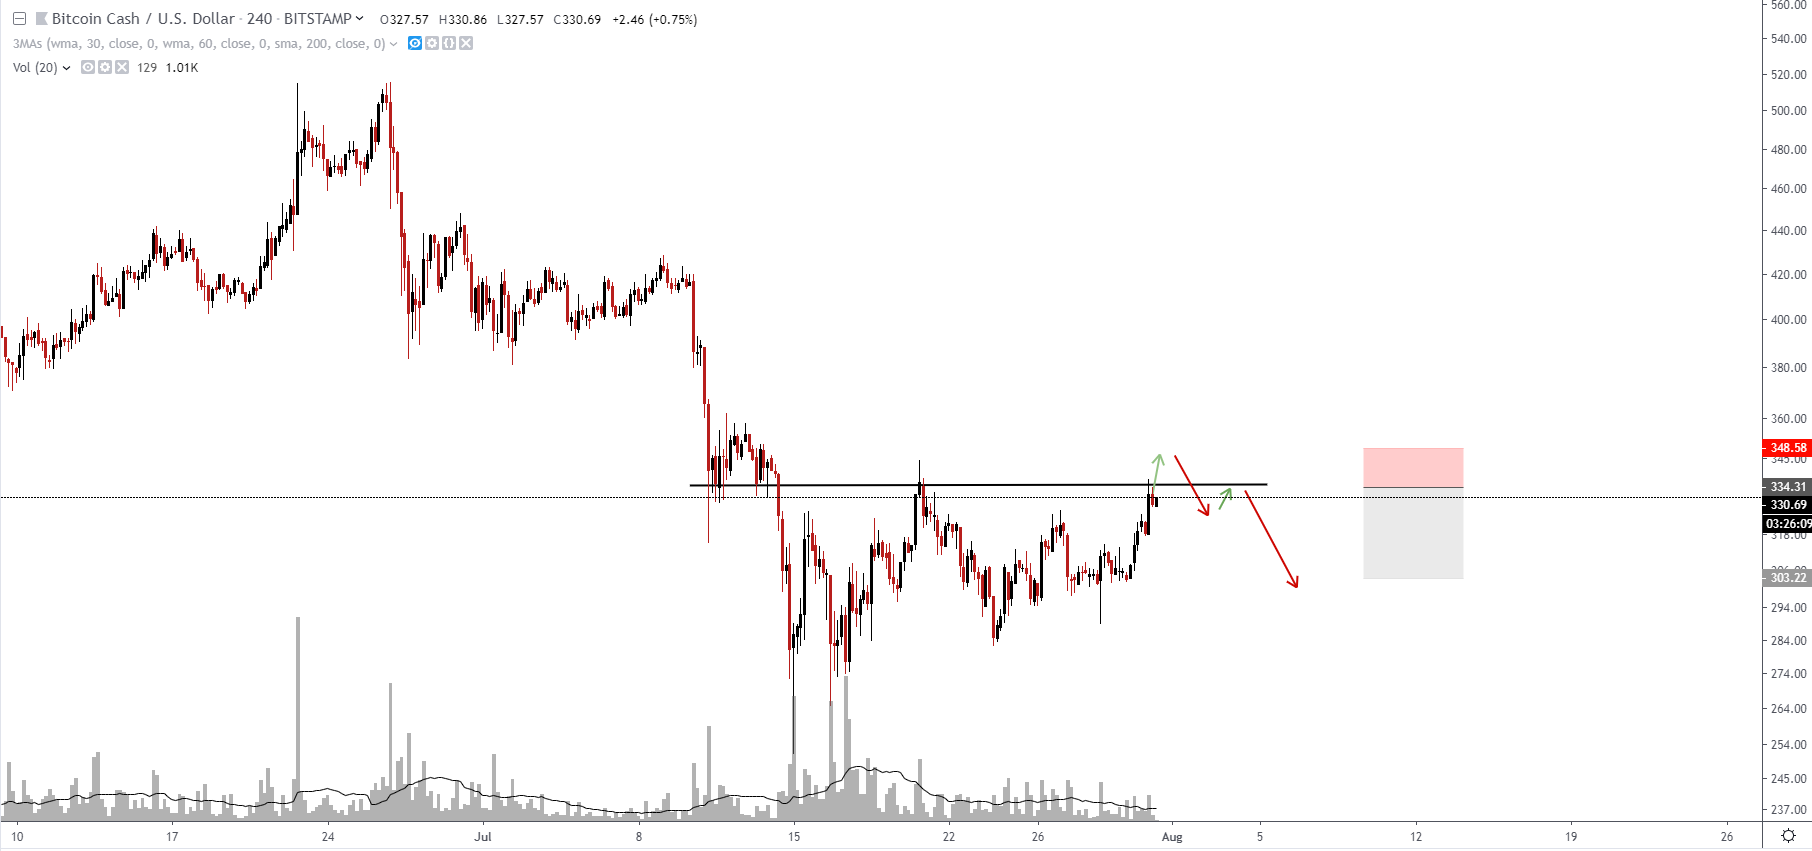
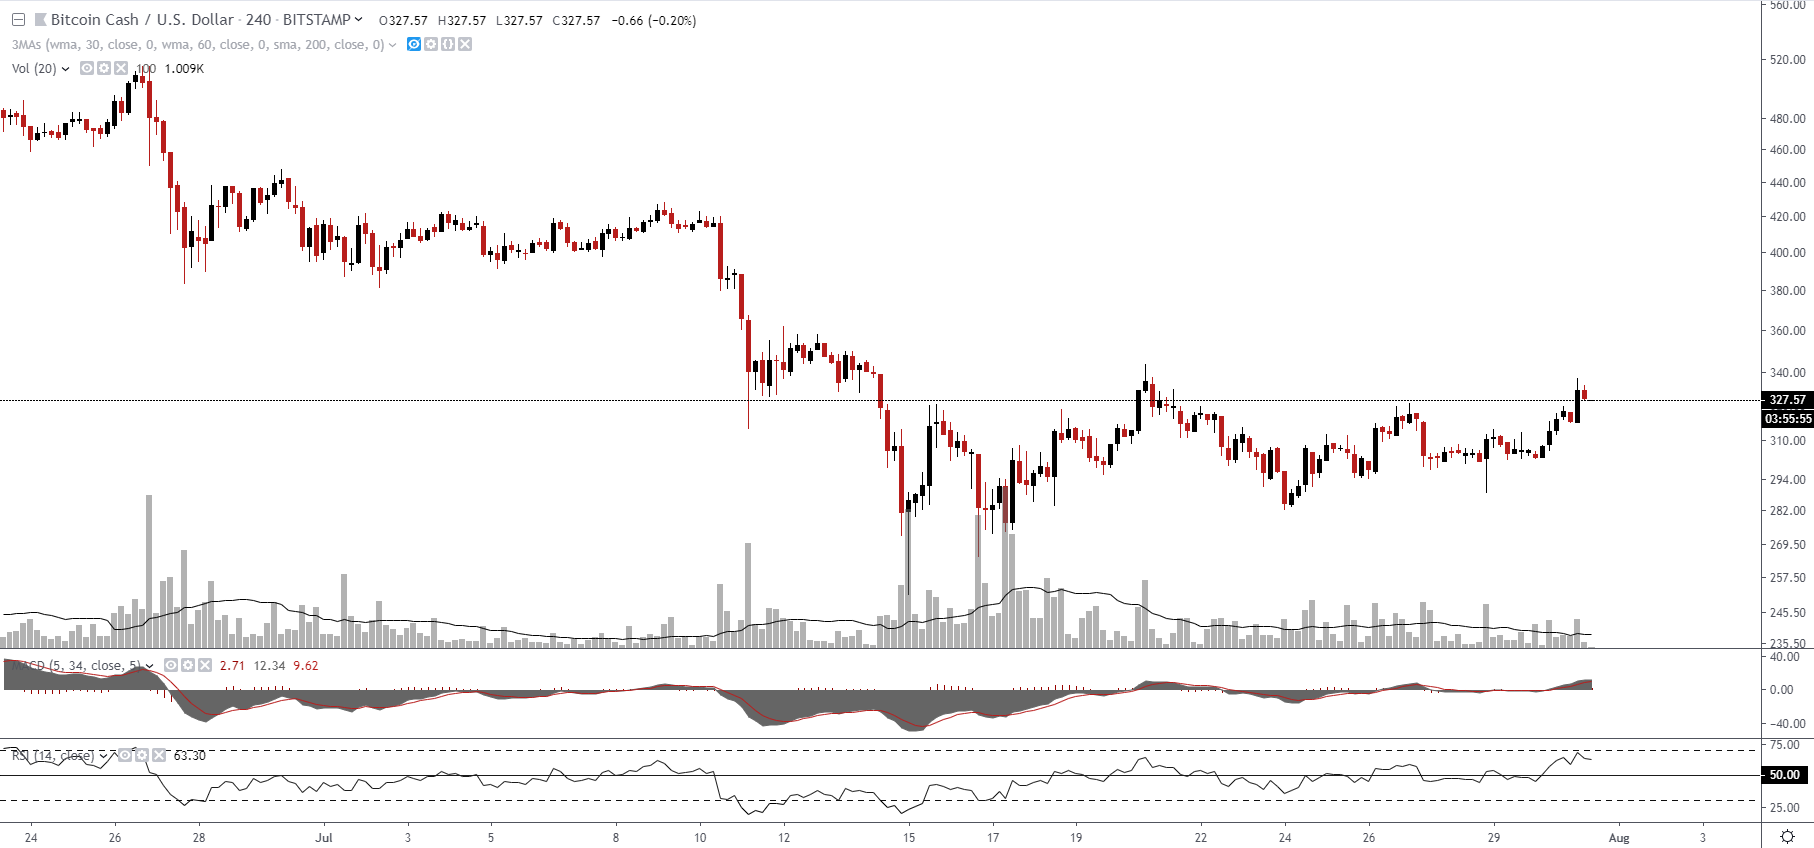
On the 4 hr scale, the situation is better and the indicators in the bullish zone but will be better to see their confirmations when the price jumped out that consolidation
The market depth shows 'Bids' and 'Asks' parity but anyway 'Asks' and the price in divergence and it looks more bearish

The weekly MDR shows it clearly and here is easy to see how 'Asks' raises when the price is climbing up

Conclusions:
If you are bullish
Entry - 335$, stop -308$, take - 385$

If you are bearish
Entry - 335$, stop - 350$ (in the framework of a false breakout) take - 305$