Javascirpt Anti Debugging
Author: Juan Manuel Fernandez 翻译: Mour原文: https://x-c3ll.github.io/posts/javascript-antidebugging/
Last summer I spent a lot of time talking with @cgvwzq about antidebugging tricks in JavaScript. We tried to find resources or articles were this topic was analyzed, but the documentation is poor and mostly incomplete. You can find little tricks around the net, but we could not find a resource where all of them were collected. So… here comes our quest.
上个夏天,我和@cgvwzq花费大量时间对js反调试技术进行了探讨。我们尝试去查找一些资料,却发现关于该方面的资料比较匮乏, 只有一些零散的技巧记录, 很难找到较为系统的记载。所以, 我们做了一些探索。
The intention of this article is to collect little tricks (some of them seen already used by malware or comercial products, and other ideas are ours) related to antidebugging in JavaScript.
写这篇文章的主要目的是用来收集一些jstricks(其中的一些技巧好像已经用于病毒和商业产品中了,但是知识是大家的)
Keep in mind this: we are not talking about silver bullets. It’s JavaScript. With time and coffee you can debug and reverse the logic inside a snippet of JavaScript. What we want to offer is just some ideas to difficult the task of understand what the code does. Indeed what we show here are techniques not related with obfuscation (tons of information and tools are available), they are more oriented to difficult actively the debugging process.
首先声明: 我们讨论的是JavaScript而不是"银弹"。 通常,花费一定时间和精力。你就可以调试和逆向其中的逻辑。而我们希望通过提供一些好主意去增加其中的难度。但事实上本篇文章涉及到的技术无关JS混淆。
In a general way, the approachs of the techniques shown in this post are:
- Detect unexpected enviroments of execution (we only want to be executed in browsers)
- Detect debugging tools (for example DevTools)
- Code Integrity Controls
- Flow Integrity Controls
- Anti-emulation
一般来说,本篇介绍的几种技术,即可达到该效果:
- 异常环境检测(我们只想自己的代码运行在浏览器中)
- 调试工具检测
- 代码完整性检测
- 数据流完整性检测
- 反模拟
Our main idea is to combine the techniques shown here with obfuscation and cryptography. The code is splitted in a serie of encrypted code-blocks were the decryption process of every blocks depends on other blocks previously decrypted. The intended program flow is to jump from encrypted block to encrypted block in a known sequence. If any of our checks detect something “odd”, the program flow changes his natural path and reach fake blocks. So, when we detect someone debugging our code we just send him to a fake region, keeping the “interesting” parts away from him.
我们主要通过结合以上几种技术和加密混淆。代码将被切片成一系列的加密代码块。每一块解密都依赖与上一步解密过的代码块。这样程序运行时代码流将被加密。如果我们的检测到异常,程序流将改变自然路径,切换至虚假代码块。所以,当我们检测到调试者,可以通过让其运行在虚假空间。从而隔离真正的代码块。
If you know more tricks that are not listed here, please contact me at @TheXC3LL so I can add them to this article.
如果你知道更多的技巧,请联系我们增加到文章中。
0x01 Function redefinitions
This is for far the most basic and well-known technique used to avoid someone to debug our code. In JavaScript we can redefine the functions that are used usually to retrieve information. For example, console.log() is used to show in the console information about functions, variables, etc. If we redefine this function, and we change his behaviour, we can hide certain information or just fake it.
函数重定义是一项众所周知的基础技巧。在JavaScript中重定义函数通常用来检索信息。例如,console.log()被用来在终端中打印函数,变量等等。如果我们重定义console.log,改变他的行为,我们可以隐藏特定的信息,或者直接输出虚假信息。让我们在DevTools运行下面的代码。
To see it in action, just run this inside your DevTools:
console.log("Hello World");
var fake = function() {};
window['console']['log'] = fake;
console.log("You can't see me!");
What we should see is:
VM48:1 Hello World
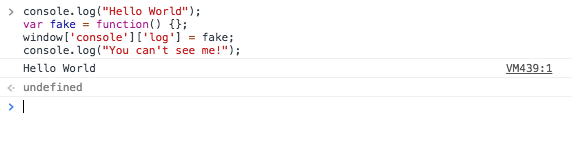
The second message is not shown because we “disabled” the function with a redefinition to an empty function. But we can be a bit more ingenious and just change his behaviour to show fakec information. To ilustrate it:
可以看到当我们重定义console.log为一个空的函数时,"You can't see me" 就不再被打印出来。但是我们还可以做的更加精妙一些。如果你了解过hooking,你会发现两者相像。
console.log("Normal function");
// First we save a reference to the original console.log function
var original = window['console']['log'];
// Next we create our fake function
// Basicly we check the argument and if match we call original function with other param.
// If there is no match pass the argument to the original function
var fake = function(argument) {
    if (argument === "Ka0labs") {
        original("Spoofed!");
    } else {
        original(argument);
    }
}
// We redefine now console.log as our fake function
window['console']['log'] = fake;
// Then we call console.log with any argument
console.log("This is unaltered");
// Now we should see other text in console different to "Ka0labs"
console.log("Ka0labs");
// Aaaand everything still OK
console.log("Bye bye!");
And if everything works…
Normal function
VM117:11 This is unaltered
VM117:9 Spoofed!
VM117:11 Bye bye!

If you played before with “hooking” this will sound familiar to you.
We can be even more clever and redefine other functions more interesting in order to control the code executed in an unexpected way. For example, we can build a snippet based on the code shown before to redefine the eval function. We can pass JavaScript code to the eval function, so this code will be evaluated and executed. But if we redefine the function, we can run a different code. So… what you see is not what you get :).
我们可以更加聪明的重定义其他函数,为了控制代码非非预期执行。例如,我们可以构建一段代码去重定义eval函数,然后传递javascript代码给eval函数,由eval执行。但是一旦我们重定义函数,我们可以运行不通的代码。因此,你看到的,不一定是你得到的。
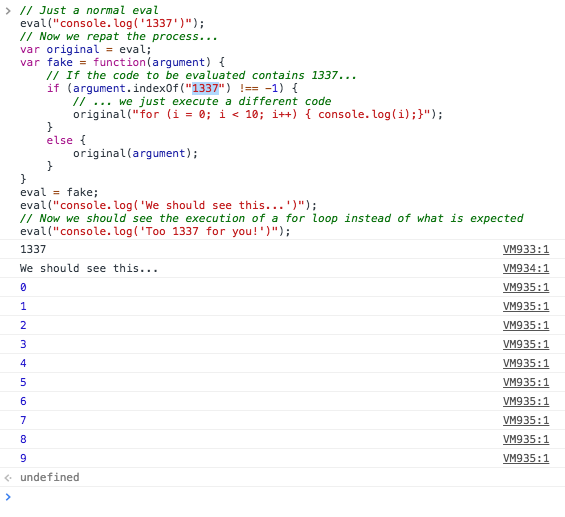
// Just a normal eval
eval("console.log('1337')");
// Now we repat the process...
var original = eval;
var fake = function(argument) {
    // If the code to be evaluated contains 1337...
    if (argument.indexOf("1337") !== -1) {
        // ... we just execute a different code
        original("for (i = 0; i < 10; i++) { console.log(i);}");
    }
    else {
        original(argument);
    }
}
eval = fake;
eval("console.log('We should see this...')");
// Now we should see the execution of a for loop instead of what is expected
eval("console.log('Too 1337 for you!')");
And… Yep, we executed a different code (the “for” loop instead of the console.log with the string “Too 1337 for you!”).
1337
VM146:1 We should see this...
VM147:1 0
VM147:1 1
VM147:1 2
VM147:1 3
VM147:1 4
VM147:1 5
VM147:1 6
VM147:1 7
VM147:1 8
VM147:1 9
Modifying the flow of our program by this way is a cool trick, but as we said at the begin, it is the most basic trick and can be detected and defeated easily. This is because in JavaScript every function has a method toString (or toSource in Firefox) that returns its own code. So it only needs to check if the code of the desire function was changed or not. Of course we can redefine the method toString / toSource, but we are stucked in the same situation: function.toString.toString().
We will talk more about “hooking” and function redefinitons later, using another aproach based on the proxy object.
修改程序的运行流是一项很酷的技巧,但是正如开头所说,这是一个很普通的技巧。而且很容易被破解。这是因为Javascript每个函数都有一个方法toString(Firefox中是toSource)去返回所属的代码。所以,只需要去检测代码的期望函数是否被改变就可以发现问题所在。当然我们也可以重定义toString/toSource函数,但是仍然会出现这种情况: function.toSting.toString().
接下来我们将讨论下基于代理模式的hooking和函数重定义。
0x02 Breakpoints
The tools used to debug JavaScript (for example DevTools) has the capacity of block the script execution at an arbitrary point in order to help us to undertand what is happening. This is done with “breakpoints”. Using breakpoints when you are debugging helps you to see what happened, what is happening and will happen next, so they are one of the most fundamentals basis of debugging.
If you played a bit with a debugger and the x86 family probably you know about the 0xCC instruction. In JavaScript we have an analog instruction called debugger. Placing a debugger; sentence inside your code will produce a stop in the execution of your script when the debugger hit that instruction. Example:
用于调试JavaScript的代码都可以从任意地方打断点帮助我们去理解到底发生了什么,例如DevTools. 当你调试时使用断点可以帮助你查看发生了什么,接下来将要发什么,这些都是调试所需的基础。
如果你打算在x86系列上调试,可能你需要知道0xGC的指令。在Javascript中我们模拟该指令,称之为debugger. 当你使用debugger,在你的代码内部将会产生断点。
console.log("See me!");
debugger;
console.log("See me!");
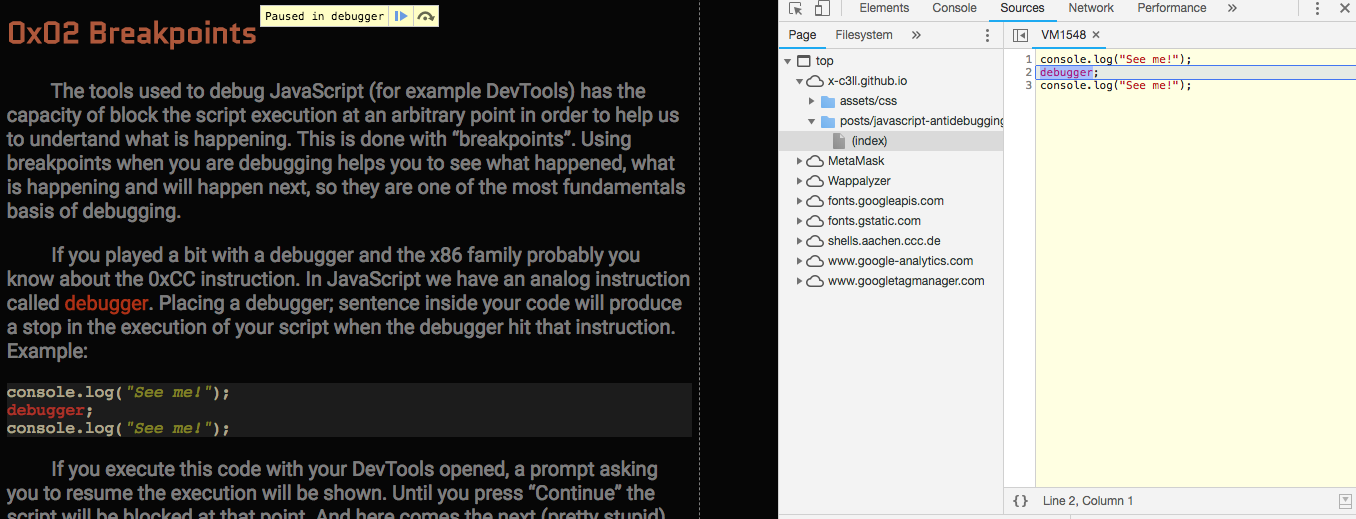
If you execute this code with your DevTools opened, a prompt asking you to resume the execution will be shown. Until you press “Continue” the script will be blocked at that point. And here comes the next (pretty stupid) trick seen in comercial products: just put a infinte loop of debugger;. Some browsers prevents this situation, others not. But the concept inside this is just to annoy the guy debugging your code. The loop will flood you with a torrent of windows asking to resume the execution, so we can’t start to work reversing the script until this is fixed.
setTimeout(function() {while (true) {eval("debugger")
Other trick related with breakpoints will be explained in next section.
如果你的执行了这段代码,浏览器将会提示你去恢复代码运行。直到你点击了继续按钮,否则代码执行将一直被阻塞。有的商业产品采用这种技巧,并在代码中加入一个死循环的debugger,尽管看起来如此sb。当然,有的浏览器会阻止这种情况,有的并不会。但是这个概念旨在用于调试代码。断点在恢复前,代码将无法执行,所以我们不能进行逆行脚本,直至恢复。
0x03 Differences of time
Another trick borrowed from classic anti-reversing techniques is to use checks based on time. When a script is executed with DevTools (or similar), the execution time is markedly slowed. This situation can be abused by us using the time as a little canary that tells us if we are being debugged or not. This aproach can be done in differentes ways.
For example we can measure the elapsed time betweeen two or more points inside the code. If we know the elapsed mean time between those points in “natural” conditions we can use this value as a reference. An elapsed time bigger than the expected would mean that we are being under a debugger.
Other idea based on this topic is to have some functions with loops or another “heavy” code wich execution time is known:
另一个技巧来自经典的反逆向技术:时间差。当一个脚本在DevTools中执行,明显会比正常的运行时间较慢。时间像个金丝雀一样可以告诉我们正在调试与否,但这种解决方法可能会被滥用。
举例,我们可以计算在两个或两个以上断点耗费的时间。如果我们知道正常情况下的平均时间,我们可以用这个值作为参考。所有超出预期的时间,意味着代码处在调试环境。
setInterval(function(){
  var startTime = performance.now(), check, diff;
  for (check = 0; check < 1000; check++){
    console.log(check);
    console.clear();
  }
  diff = performance.now() - startTime;
  if (diff > 200){
    alert("Debugger detected!");
  }
}, 500);
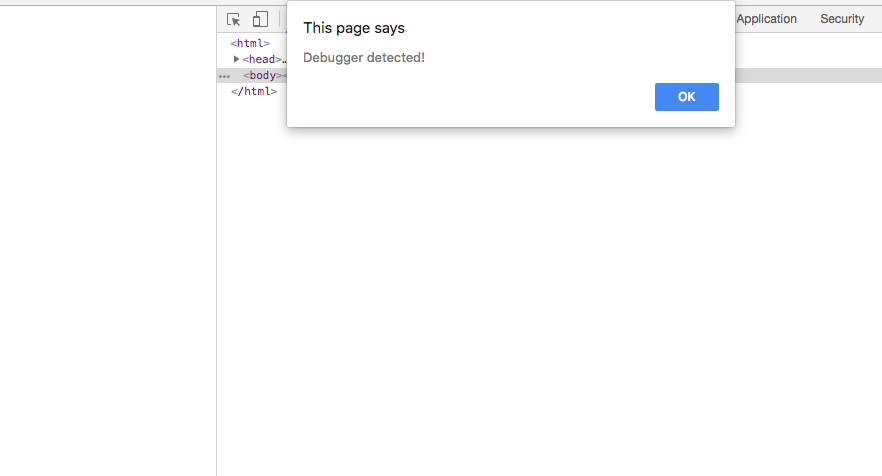
First run that code without DevTools opened and later open it. As you can see we could detect the presence of a debugger because the time difference was greater than the expected. This approach to using time references as a canary can be combined with what is shown in the previous section. So we can take a time reference before and after a breakpoint. If the breakpoint is executed, the amount of time lost before we can resume the execution will reveal the presence of a debugger.
当我们第一次运行这种代码(不在DevTools中),随后再打开DevTools.正如你所看到,我们可以检测到debugger的存在。因为时间明显的比我们的预期较长。所以我们可以通过断点前后的参考时间达到检测的效果。如果断点执行了,我们必须要花费一定的时间去恢复代码的运行。
    var startTime = performance.now();
    debugger;
    var stopTime = performance.now();
    if ((stopTime - startTime) > 1000) {
        alert("Debugger detected!")
    }
These time checks can be placed at random points inside the code so it will be harder to the analyst to spot them.
时间差检测的代码可以放在代码中任意部分,这将会增加分析代码的难度。
0x04 DevTools detection (Chrome)
The first time I saw this technique was in this Reddit Post. As is said in the post:
The technique used is to implement a getter on the id property of a div element. When that div element is sent to the console like console.log(div);, the browser automatically tries to get the id of the element for convenience. Hence, if the getter is executed after calling console.log, this means the console is opened.
A simple Proof of Concept:
第一次看到这种概念是在reddit上,正如该帖所言:
该技术用来实现是基于div的id属性。当div元素被打印到终端。例如console.log(div).浏览器为了方便会自动的尝试去得到元素的id。因次,如果检测到获取属性是在调用console.log之后,这就意味着,console是打开的。
let div = document.createElement('div');
let loop = setInterval(() => {
    console.log(div);
    console.clear();
});
Object.defineProperty(div, "id", {get: () => {
    clearInterval(loop);
    alert("Dev Tools detected!");
}});
0x05 Implicit control of flow integrity
One of the first steps when we try to deobfuscate a JavaScript snippet is start to rename some variables and functions in order to clarify the source code. You just split the code in smaller chunks of code and begin renaming here and there. In JavaScript we can check if the name of a function has changed or keep the same name. Or to be more correct we can check if the stack trace contains the original names and the original order.
当我们解密一段混淆的JavaScript代码时,首先第一步是重命名一些变量名和函数,以便代码结构清晰。你只需要切分代码成小的代码块,然后开始重命名。在JavaScript中,我可以检测是否一个函数的名称改变了或者还保持原来的名称。或者更好的做法是我们可以跟踪栈的调用时原来的名字和执行顺序。
With arguments.callee.caller we can create a stack trace where we save the functions executed previously. We can use this information to generate a hash that will be the seed used to generate the key to decrypt other parts of our JavaScript. In this way we have an implicit control of the flow integrity because if a function is renamed or the order of functions to be executed is slightly different, the hash created will be totally different. If the hash is different, the key generated will be different too. If the key is different, we can’t decrypt the code. To understand it better see next example:
使用 arguments.callee.caller 我们可以创建一个栈的追踪用来保存先前执行的函数。我们可以使用这个信息去生成一个哈希值用来作为种子去生成Key解密部分的JavaScript代码。在这种方式,我们显示的控制代码流。如果函数是被重命名或者函数的顺序发生了轻微的改变,Key也会改变。而Key不同,我们不能解密代码。下面的例子可以帮助我们去理解。
function getCallStack() {
    var stack = "#", total = 0, fn = arguments.callee;
    while ( (fn = fn.caller) ) {
        stack = stack + "" +fn.name;
        total++
    }
    return stack
}
function test1() {
    console.log(getCallStack());
}
function test2() {
    test1();
}
function test3() {
    test2();
}
function test4() {
    test3();
}
test4();
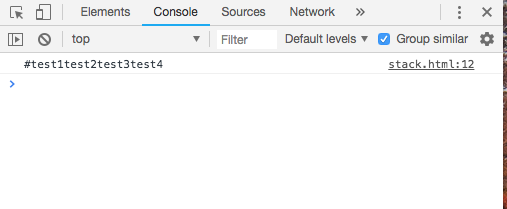
When you execute this code you will see the string #test1test2test3test4. If we modify (I invite you to do it) the name of any function the returned string will be different too. We can calculate a secure hash with that string and use it later as seed to derive the key used to decrypt other code-blocks. An interesting point here is that if we can not decrypt the next code-block because the key is invalid (the analyst changed a function name) we can catch the exception and redirect the execution flow to a fake path.
Keep in mind that this trick needs to be combined with strong obfuscation to be useful.
当你执行这份代码,可以看到终端打印出了 #test1test2test3test4。 如果我们修改函数的任何一个名字,返回的字符串也将不一样。我们可以用这个字符串去计算一个安全哈希值,并使用他进行迭代计算解密其他的代码块。有意思的是,如果我们因为Key不正确而不能解密下一个代码块,我们可以接收异常然后重定向程序执行到虚假的路径。记住,这种技巧需要强的混淆技能才显得有用。
0x06 Implicit control of code integrity
At the end of section “0x01 Function redefinitions” we mentioned that we can retrieve the code of a function in JavaScript with toString() method. As we said, this can be useful to check if a function was redefined, and indeed, this very same idea can be used to know if the code of a function was modified.
在第一节的结尾我们提到了我们可以使用toSting()遍历JavaScript函数里的函数。正如我们之前所说,这用来检测函数是否被重定义很有用,而且事实上,这是一个非常相似的主意被用来检测函数是否修改了。
The less efective way to do it is to calculate the hash of functions or code blocks and compare it with a pre-known table. But this approach is really stupid. A more realistic and efective approach can be repeat the same strategy that we used before with the stack traces. We can calculate the hash of a chunk of code and use it as a key to decrypt other blocks of code.
不太有效的方式是计算函数的哈希或者代码块的哈希,然后和已知的进行比较。但是这样做真的是不能再SB了。一个更有效的方法是重复之前栈追踪的技巧,计算每个块的哈希值,然后用来解密之后的代码块。
The most beautiful idea in order to create an implicit integrity control is to use collisions in md5. This idea was coined by @cgvwzq after few beers last summer. Basicly we can create functions where its own md5 is tested inside the own function. In order to perform the check inside the function we need to play with collisions (we want to create something like function(){ if (md5(arguments.callee.toString() === '<md5>') code_function; }.
更优雅的做法是使用md5碰撞去达到隐氏的完整控制。这个主意是@cgvwzq上个夏天喝两杯后想出来的(代码就酒,越喝越有)。基本上就是在一个函数内创建一个自产生md5的函数。为了去检查这个函数内部,我们需要碰撞一下,像是这样。
The concept behind this technique is the same used to generate image files wich md5 checksum is shown in the own picture. Here is an classic example: a gif showing his own md5 checksum.
这个概念背后的技术同样被用于图片生成自身的md5.这个是一个经典的例子,gif图展示了属于他自己的MD5校验值。
About how to create this type of collisions there are tons of articles (even appeared some examples in PoC||GTFO) but the first one I read and could replicate was this with PHP. You can precalculate pretty fast the blocks needed to generate the collisions. Indeed here is an example created by @cgvwzq were the integrity of the function content is checked by this way.
As we stated before we need to use strong obfuscation with this kind of techniques.
关如何创建这种类型的碰撞,这里有很多的文章。你可以先计算出一块用于生成碰撞,事实上,这里有个@cgvwzq写的实例。
0x07 Proxy Objects
The proxy object is one of the most useful tools introducted recently in the world of JavaScript. This object can be used to snoop inside other objects, change its behavior (like a hook), or trigger an action under certain circumstances. For example if we want to trace every call to document.createElement and log this information we can create a proxy object:
最近在Javascript世界里经常被介绍的代理对象是一种非常有用的工具,这个对象可以用来探测其他对象,并改变他们的行为(类似hook),或者在某些情况下触发。举个例子,如果我们想追踪所有 document.createElement 的调用并打印出信息,我们可以创建一个代理对象。
const handler = { // Our hook to keep the track
    apply: function (target, thisArg, args){
        console.log("Intercepted a call to createElement with args: " + args);
        return target.apply(thisArg, args)
    }
}

document.createElement = new Proxy(document.createElement, handler) // Create our proxy object with our hook ready to intercept
document.createElement('div');
Then we will see that when we call createElement its args will be logged in console:
VM64:3 Intercepted a call to createElement with args: div
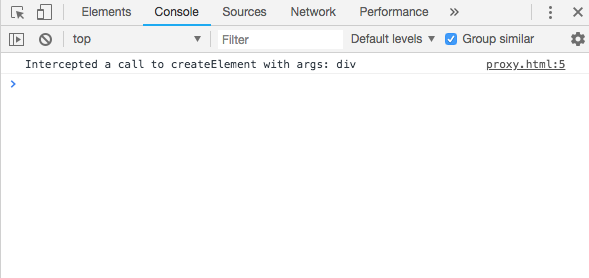
That is great! We can use this to help us to debug code via the interception of some well-known functions (a là strace / ltrace). But as we saw in section “0x01 Function redefinitions” we can use this very same approach to hide or fake information, or just to run code different to what we see (you can simply replace the logic inside the hook show in the example). This kind of function hooking is far better than a simple redefinition.
Our main focus in this humble article is to provide some ideas to use as antidebugging tricks, so… can we detect if the analyst is using a proxy object? Indeed we can, but this is a cat and mouse game. For example, using the same code snippet, we can try to call toString method and catch the exception:
很好,我们可以使用它来帮助我们通过拦截一些众所周知的函数来调试代码(a là strace / ltrace)。但是我们看到第一节中我们使用了重定义虚假函数,或者运行不同的代码来达到效果。你可以直接替换例子中hook的代码。而现在这种函数hooking远比简单的重定义要好。
我们这篇文章浅谈了下一些用来反调试的技巧。但,假如分析者也采用了代理对象的方法呢? 事实上我们可以的,但是这就像猫和老鼠的一样。举例来说,使用同样的代码,我们可以尝试去调用toString的方法去捕获异常。
// Call a "virgin" createElement:
try {
    document.createElement.toString();
} catch(e){
    console.log("I saw your proxy!");
}
Here all still ok:
"function createElement() { [native code] }"
But when we use the proxy…
//Then apply the hook
const handler = {
    apply: function (target, thisArg, args){
        console.log("Intercepted a call to createElement with args: " + args);
        return target.apply(thisArg, args)
    }
}
document.createElement = new Proxy(document.createElement, handler);

//Call our not-so-virgin-after-that-party createElement
try {
    document.createElement.toString();
} catch(e) {
    console.log("I saw your proxy!");
}
Yep, we could detect that proxy:
VM391:13 I saw your proxy!
As we said: this is just a mouse and cat game. We can add the toString method:
const handler = {
    apply: function (target, thisArg, args){
        console.log("Intercepted a call to createElement with args: " + args);
        return target.apply(thisArg, args)
    }
}
document.createElement = new Proxy(document.createElement, handler);
document.createElement = Function.prototype.toString.bind(document.createElement); //Add toString
//Call our not-so-virgin-after-that-party createElement
try {
    document.createElement.toString();
} catch(e) {
    console.log("I saw your proxy!");
}
Now our detection will fail:
"function createElement() { [native code] }"
0x07 Restrictional enviroments
As we stated in the introduction, one of the things that we want is to try to detect if the code is being executed inside the right enviroment. What we call “the right enviroment” is:
- The code is being executed in a browser (not an emulator, not NodeJS, …)
- The code is being executed in the domain / resource destinated to it (not a local server)
For example, an easy check that we can perform to prove if the code is executed locally is:
正如文首介绍,其中一种方法是通过检测代码运行环境,是否在正常的环境。我们称之为正常环境的意思是:
- 代码正在浏览器被执行(不是在模拟器里,不是nodejs里, ...)
- 代码正在当前域名下执行,接收由远端服务器传输资源过来的资源。(不是通过本地服务器)
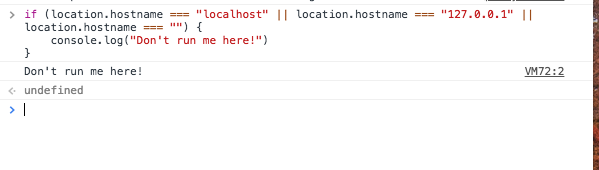
// Pretty stupid idea found in commercial software
if (location.hostname === "localhost" || location.hostname === "127.0.0.1" || location.hostname === "") {
    console.log("Don't run me here!")
}
If we run this JavaScript snippet inside a local html we will see the message:
VM28:3 Don't run me here!
Following this idea another option to check is the handler used to open the document (something like if (location.protocol == 'file:'){...}) or try to test via HTTP requests if other resources (images, css, etc.) are available. Of course all of these methods are extremely easy to bypass.
A bit more interesting idea is to avoid the execution if the code is executed in NodeJS (or as we repated in this article: change the flow to a faked path). This is dangerous but I saw in the wild people using NodeJS to solve JavaScript challenges and bypass anti-bruteforcing mitigations.
We can try to detect the existence of objects that only exists in a browser context:
随着这个思路,作者的观点是去检查文档打开的句柄(一些类似 if (location.protocol == 'file:'){...})或者尝试通过HTTP请求测试是否其他资源是可用的。当然所有的方法都是很容易被绕过。
有趣的一点是去避免代码执行在NodeJs环境中(或者像开头所说,引向虚假运行环境)。这是很危险的,但是我看到一些人还是用NodeJs去解决JavaScript的一些问题以及用来缓解绕过反爆破。(这句话太™拗口了)
我们可以尝试下去检测只存在浏览器中上下文的对象。
//Under NodeJS
   try {
..   console.log(window);
   } catch(e){
..      console.log("NodeJS detected!!!!");
   }

NodeJS detected!!!!
And viceversa: in NodeJS we have objects that does not exists in a browser context.
//Under the browser
console.log(global)
VM104:1 Uncaught ReferenceError: global is not defined
    at <anonymous>:1:13

//Under NodeJS
  console.log(global)
{ console:
   Console {
     log: [Function: bound log],...
     ...
We can search for tons of metadata that exists only in a browser. Some ideas of this kind that we can retrieve can be seen in the Panopticlick Project.
我们可以搜索浏览器中的元数据,一些类似的项目可以通过搜索查到,例如 Panopticlick.
0x08 WebGL
We will not talk about anti-reversing or obfuscation inside WebGL because you can find tons of information in the net (and WebGL is dark and full of terrors). Instead of that we will mention the use of WebGL to process data and interact with the JavaScript, so if someone tries to “emulate” our snippet of JavaScript he will need to provide WebGL support to his emulator.
We can implement a simple algorithm (like a multicolor fractal, for example) to create images based on various seeds, then extract the value of pixels at predefined positions and use it as key to decrypt code-blocks. I want to talk in deep about this topic in the future, so I let this section as a stub :P
我们将不再探讨关于反逆向或者混淆在WebGL中,因为你可以在网上发现大量的相关内容。相反,我们提示你使用WebGL去处理数据并用JavaScript进行交互,如果一个人尝试用模拟器,我们的JavaScript代码将需要提供WebGL去支持。
我们可以实现一个简单的算法(例如multicolor fractal)去创建一个基于多种子的镜像。接着在预定义的位置抽取其中的像素值并使用其作为key去解密代码块。我想在接下来的时间讨论下这个问题,留个坑,以后再写。
0x09 WebAssembly
当然这种方法,原文并没有介绍。WebAssembly可以将js代码直接编译成二进制在浏览器中运行,但是由于WebAssembly并没有普及,浏览器的支持有问题。可以通过demo来看下。
Final words
I hope this collection of tricks can be helpful for you. If you know more, or notice any error or possible improvement of this article, feel free to ping me at my twitter @TheXC3LL.
我希望这个技巧合集可以帮助你,如果你知道更多的技巧,或者注意到文中的哪些错误。不吝赐教
Kudos to @cgvwzq for his help :)
Byt3z!