HK50: Ichimoku indicators analysis
20 декабря 2023, 18:27
Сценарий Таймфрейм Intraday Рекомендации SELL Точка входа 16580.0 Take Profit 16421.0 Stop Loss 16650.0 Ключевые уровни 16200.0, 16421.0, 16650.0, 17000.0
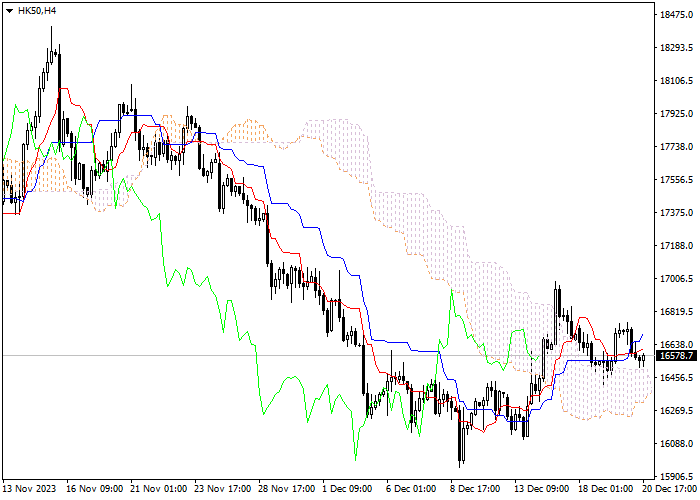
Let's look at the four-hour chart. Tenkan-sen line is below Kijun-sen, both lines are directed upwards. Confirmative line Chikou Span is approaching the price chart from above, current cloud is descending. The instrument is trading around upper border of the cloud. The closest support level is Kijun-sen line (16650.0). One of the previous maximums of Chikou Span line is expected to be a resistance level (16421.0).
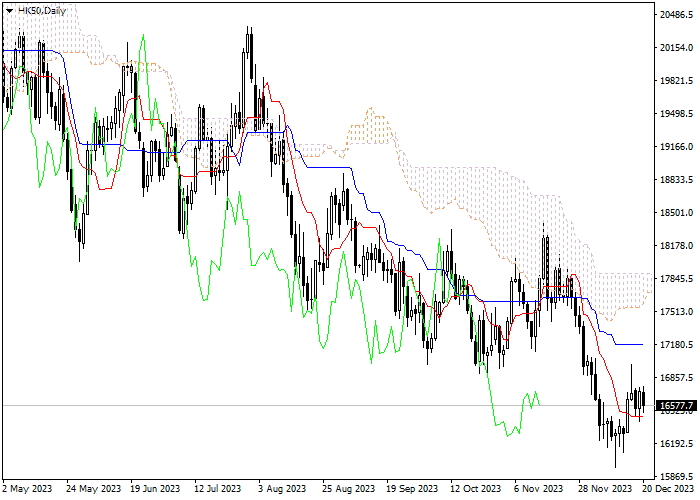
On the daily chart Tenkan-sen line is below Kijun-sen, the lines are horizontal . Confirmative line Chikou Span is below the price chart, current cloud is descending. The instrument is trading between Tenkan-sen and Kijun-sen lines. The closest support level is Kijun-sen line (17000.0). The closest resistance level is Tenkan-sen line (16200.0).
On the both charts the instrument is still falling. It is recommended to open short positions at current price with Take Profit at the level of previous minimum of Chikou Span line (16421.0) and Stop Loss at the level of Kijun-sen line (16650.0).